Are Gantt charts outdated, or do they still earn their place?
Gantt charts are not outdated, but they are widely misused, which is what makes them feel that way. The chart Henry Gantt popularized over a century ago does one thing extremely well: it shows how tasks line up over time and which ones block which. Agile and kanban did not kill that need, they just moved most teams away from planning the whole timeline up front. So the honest answer to "relic or essential" is neither. A Gantt chart is essential the moment you have to coordinate work across teams, dates, and dependencies, and it is dead weight when your work is a fast, self-contained loop of tasks. The skill is knowing which situation you are in, and using the right tool, often both at once.
What a Gantt chart does that a board does not
A kanban board answers one question well: what is the status of everything right now. You glance at the columns and see what is in progress, what is done, and what is waiting. That live snapshot is the whole point, and it is why boards feel so natural for day-to-day execution. What a board cannot show you is time. It does not know that the design has to finish before development starts, or that a launch is fixed for the 14th and three things have to land before it.
A Gantt chart is built around exactly that. It lays tasks on a horizontal timeline, gives each one a start and an end, and draws the lines between them so a dependency is something you can see rather than something you remember. That makes two things visible that a board hides. The first is duration: how long the whole thing actually takes once you account for the order things have to happen in. The second is the ripple effect: when one task slips, the chart shows you everything downstream that just moved with it.
So these are not competing views of the same data, they are answers to different questions. "What is everyone doing today" is a board question. "Will we make the deadline, and what breaks if this one task is late" is a Gantt question. Most teams need both answers, just not at the same moment.
How agile and kanban changed planning
The reason Gantt charts got a reputation as a relic is that agile genuinely changed how teams plan, and a lot of people read that change as "planning is dead." It is not. What agile rejected was the heavy, fixed, plan-the-entire-project-up-front Gantt chart that locks in twelve months of dependencies before anyone has written a line of code. That kind of plan is brittle, and when requirements shift, it becomes fiction fast.
Kanban and scrum replaced that with short, flexible cycles: pull the next most important work, finish it, repeat. For the execution layer, that is a real improvement. But notice what it quietly assumes - that you can reorder work freely and that nobody outside the team is waiting on a specific date. The minute those assumptions break, the need for a timeline comes right back. A product launch still has to coordinate development, marketing, support, and legal. A construction crew still cannot frame a wall before the foundation cures.
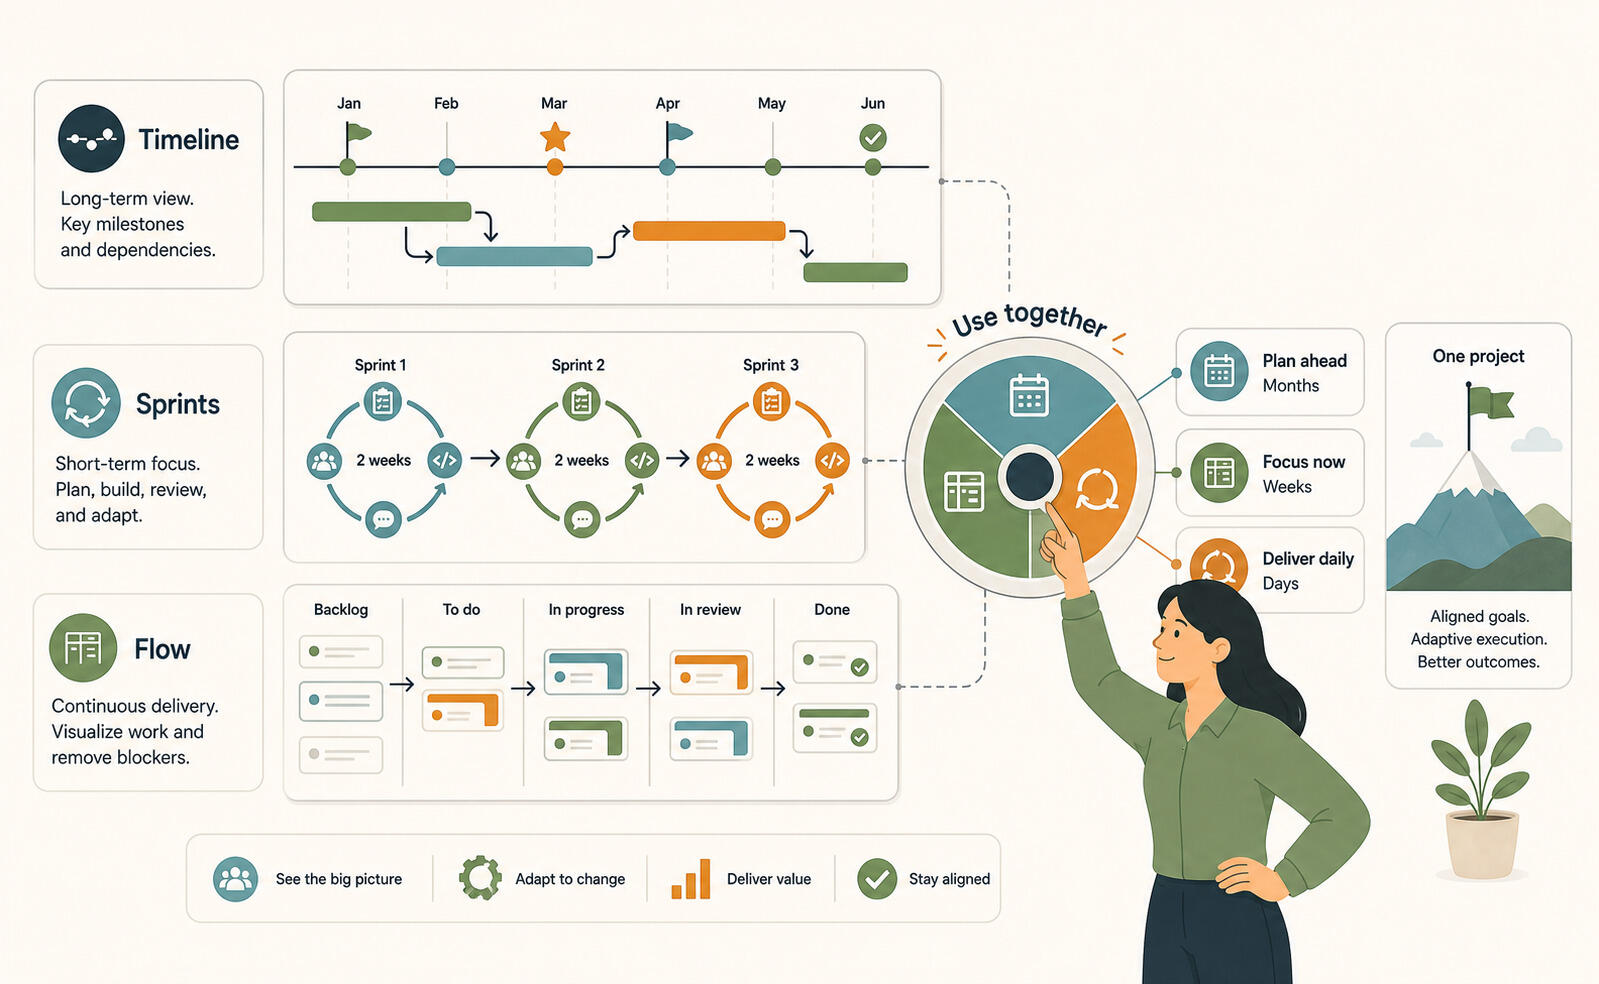
This is the part teams miss: agile is mostly a way of running the work, while a Gantt chart is a way of planning and communicating it. They sit at different altitudes. You can run sprints on a board and still keep a timeline that shows stakeholders where the whole effort lands. The two are not opposites, and treating them as a forced choice is how teams end up either over-planning or flying blind.
Gantt vs kanban: which fits which job
The clearest way to choose is to stop thinking about which tool is "better" and look at what the work in front of you actually demands. Here is how the two compare on the things that usually decide it.
| What you need | Kanban board | Gantt chart |
|---|---|---|
| Core question | What is the status right now? | How does this unfold over time? |
| Best for | Daily execution, continuous flow. | Scheduling, deadlines, the big picture. |
| Dependencies | Hard to see across columns. | Drawn explicitly between tasks. |
| Handles change | Reorder cards freely, low friction. | Needs updating, but shows the knock-on effects. |
| Audience | The team doing the work. | Stakeholders, clients, leadership. |
| Weak spot | Blind to time and sequencing. | Overkill for fast, self-contained loops. |
Read the table as a set of triggers, not a verdict. If your answers cluster in the left column - same small team, repeatable work, priorities you can shuffle - a board is plenty and a Gantt chart would just be admin. If they cluster on the right - fixed dates, cross-team handoffs, people outside the team who need to see the plan - the board alone will leave you guessing, and the timeline earns its keep.
When to reach for a Gantt chart
There is a fairly clean line for when a timeline view stops being optional. It is not about company size or methodology, it is about coordination. Three signals tell you the board has run out of road.
Dependencies cross team boundaries
Inside one team, you can usually hold the order of work in your head. Across teams, you cannot. A feature that needs a legal review before release, a campaign that needs assets approved before media buys, a build where electrical waits on framing - these handoffs are exactly what a board hides and a Gantt chart makes obvious. Seeing the dependency early is what stops the surprise handoff that stalls everything for a week.
The dates are real and fixed
Sprint backlogs are short-term by design, but launches, client deliverables, and events live on a calendar that does not move. When a date is fixed, you need to work backwards from it and check whether everything fits, which is precisely what a timeline lets you do. It also lets you forecast: if this task slips three days, do we still make the date, or does the whole thing cascade? A board cannot answer that.
Someone outside the team needs the picture
Executives and clients do not want to read a backlog or scan your columns. They want a clear overview of where things stand and where they are heading. A maintained timeline is the natural format for that - milestones, progress, and the dates that matter, all in one glance. It is also the backbone of a clean status report, because the structure is already there. If your projects involve milestones that other departments depend on, that shared view is what keeps everyone honest.
How to use both without adding overhead
The trap people fall into is treating "add a Gantt chart" as "adopt a whole new heavyweight process." It does not have to be. The best setup keeps the board as the place work actually happens and treats the timeline as a view you switch to when you need to zoom out, not a second system you maintain by hand.
In practice that means your tasks live in one place and the timeline reads from them. In Breeze, for example, the day-to-day is a kanban board, and the Gantt view is something you turn on in project settings when you want it. Once it is on, the timeline is built from your existing cards, their due dates, and their dependencies - there is nothing to re-enter, and the board and the timeline stay in sync. You run the work on the board and flip to the timeline when you need to coordinate a launch, check a deadline, or show a client where things land.
That single-source-of-truth setup is what keeps the overhead low. The classic failure is maintaining a Gantt chart in a separate spreadsheet that drifts out of date within a week, at which point nobody trusts it. If the timeline is generated from the same tasks the team already updates, it stays current for free. Start with a board, and only build out the timeline when the work crosses from a simple list into something with real dependencies and dates - usually the moment people outside your team start depending on your output. It is worth planning that project timeline deliberately before you turn it on.
Quick decision points
- Can you use a Gantt chart and agile together?
- Yes, and most teams that coordinate beyond a single squad already should. Run the work in sprints on a board, keep a Gantt chart at the level above it for cross-team timing and stakeholder visibility. They operate at different altitudes, so they do not conflict.
- Are Gantt charts only for waterfall projects?
- No. That association comes from the old habit of locking an entire project timeline up front. Used as a living view of your current tasks and dependencies, a Gantt chart works fine alongside flexible, iterative delivery.
- What is the most common Gantt chart mistake?
- Letting it go stale. A timeline is only useful if it reflects reality, so the chart has to update as the work moves. The runners-up are cramming in too much detail and setting timelines nobody can actually hit.
The short version
Gantt charts are not a relic and they are not always essential - they are the right tool for a specific job, which is coordinating work across time, dependencies, and people who are not in the room. Kanban runs the day; a Gantt chart shows where the day fits in the bigger plan. The mistake is picking a side. A good next step is to look at your current project and ask one question: does anything outside this board depend on a date? If the answer is yes, that is your cue to switch on the timeline.