Workplace productivity statistics you need to know (2026)
In 2026, workplace productivity is under pressure from two directions at once: output growth remains weak, while knowledge workers still spend too much of the day on admin, meetings, and coordination overhead. The result is a productivity conversation that is less about individual hustle and more about how work is structured.
That shift matters for Breeze. The clearest productivity gains now come from reducing work about work, centralizing updates, and keeping tasks visible enough that people stop rebuilding context all day. The statistics below show why that matters and which benchmarks are most useful for teams trying to improve output without creating even more process.
- Key workplace productivity statistics
- Work about work and admin overhead
- Meeting load and low-value work
- Context switching and fragmented attention
- Weak productivity growth at the macro level
- Tools, visibility, and workflow design
- Time management, workload control, and output quality
- Key takeaways
- FAQ
Key workplace productivity statistics (2026)
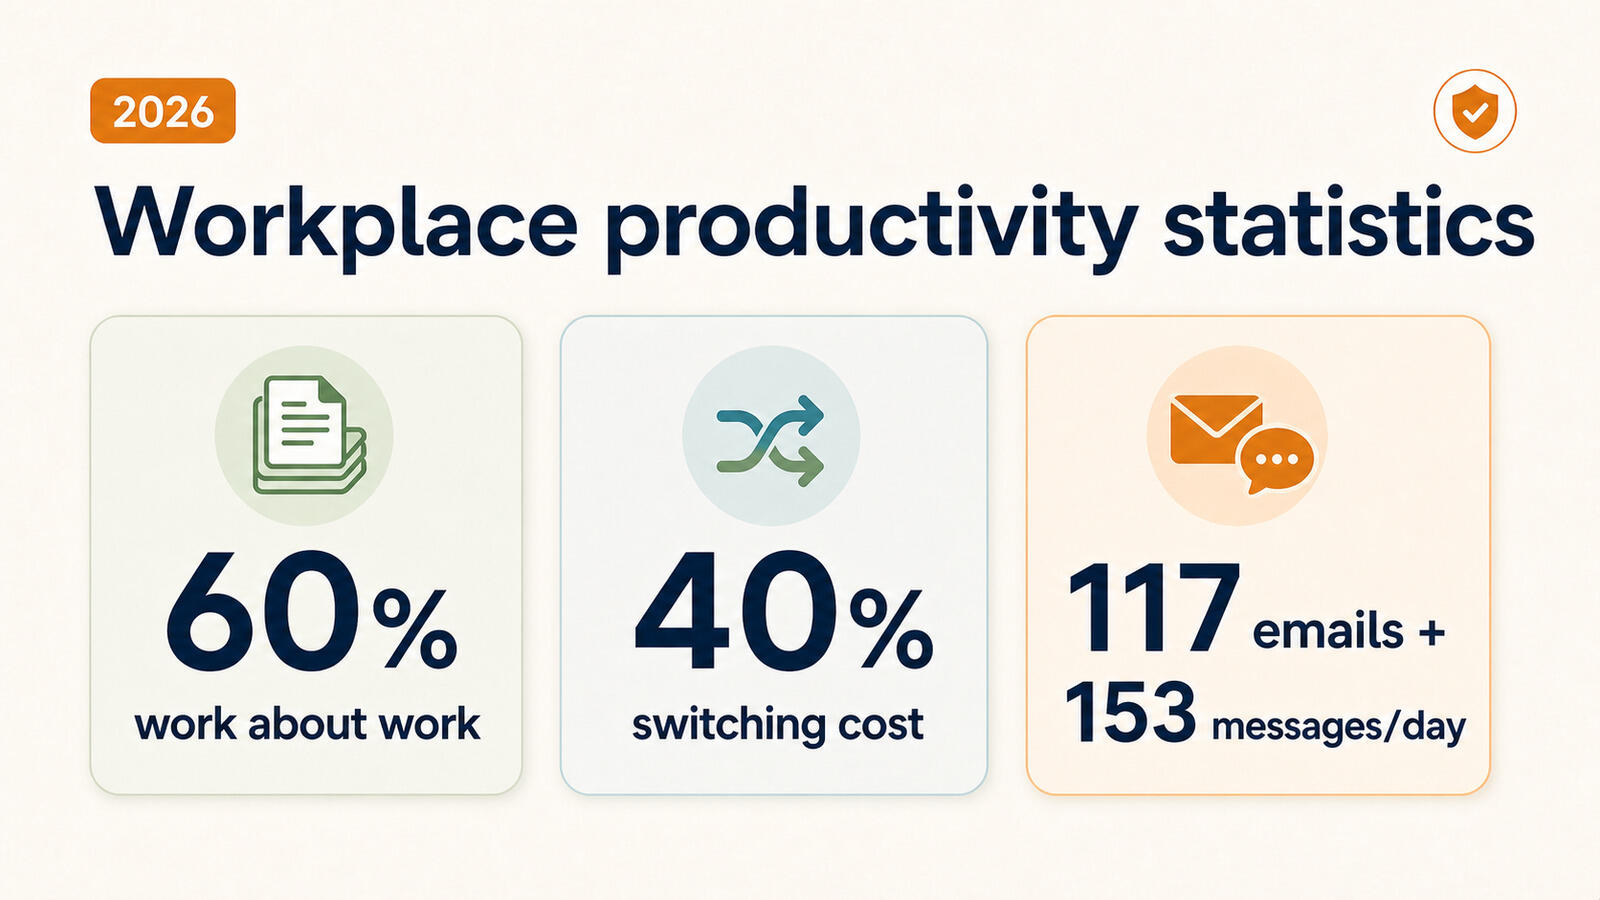
- Knowledge workers spend 60% of their time on work about work.
- Average labour productivity growth across OECD countries slowed to about 0.4% in 2024.
- Task switching can make workers up to 40% less productive.
- Knowledge workers can spend 20% to 40% of the workweek in meetings.
- 51% of the workday can go to low or no-value tasks.
- 26.5% of tasks in Breeze have time logged against them.
- Employees are interrupted every 2 minutes during core work hours.
- The average worker receives 117 emails and 153 Teams messages per day.
- 48% of employees say work feels chaotic and fragmented.
- 50% of teams spend one day or more each month manually collating project status information.
1. Work about work and admin overhead
How much time do knowledge workers spend on work about work?
Asana reports that knowledge workers spend 60% of their time on work about work, including chasing status, attending unnecessary meetings, switching tools, and coordinating across channels.
What this means: Most productivity loss is not caused by people refusing to work. It comes from workflows that force teams to restate updates, search for decisions, and maintain too many parallel systems.
Source: Asana - Work about work
How many hours are lost to unnecessary meetings and coordination?
Asana’s Anatomy of Work Index says the average knowledge worker loses 103 hours per year to unnecessary meetings.
What this means: Meeting waste is only one part of the admin burden, but it is a visible one. If status updates and clarifications are not tied to the work, teams end up paying for the same context twice: once in the meeting and again in follow-up.
Source: Asana - Anatomy of Work Index
How much time is spent talking about work instead of doing work?
Asana also reports that the average knowledge worker spends 352 hours per year talking about work, alongside those 103 hours lost to unnecessary meetings.
What this means: The real productivity question is not “how do we work faster?” It is “how do we spend less time reconstructing and re-explaining the work?” That is where centralized task systems have the biggest payoff.
Source: Asana - Anatomy of Work Index
2. Meeting load and low-value work
How much of the workweek is spent in meetings?
Multiple workplace studies summarized by Harvard Business Review estimate that knowledge workers spend between 20% and 40% of their total workweek in meetings.
What this means: Even before message follow-up and preparation are counted, meetings alone can consume one to two full workdays each week. That is why many teams now treat meeting design as a productivity issue, not just a calendar issue.
How much of the workday goes to low-value tasks?
One workplace productivity benchmark says employees spend an average of 51% of the workday on tasks that add little or no value to their core responsibilities, including redundant meetings, excessive email, and other admin-heavy work.
What this means: When half the day goes to low-value coordination, productivity improvements come less from asking people to work harder and more from redesigning how updates, approvals, and requests move through the team.
3. Context switching and fragmented attention
How much does task switching hurt productivity?
Research summaries on multitasking and task switching commonly report that switching between tasks can make people up to 40% less productive.
What this means: Treat the 40% number as an upper-bound signal, not a universal average. The practical lesson is still clear: every extra inbox, thread, and status channel increases re-entry cost and reduces useful output.
Sources: APA - Multitasking: Switching costs
Psychology Today - The true cost of multitasking
How often are employees interrupted during the workday?
Microsoft WorkLab reports that employees are interrupted, on average, every 2 minutes during core working hours by meetings, messages, or notifications.
What this means: A workday built around constant interruptions does not fail because people lack discipline. It fails because the communication system encourages reactive checking instead of deliberate progress.
Source: Microsoft WorkLab - Breaking down the infinite workday
How many interruptions can that add up to each day?
Microsoft also summarizes that being interrupted every two minutes can equal roughly 275 interruptions per day from meetings, email, or chat notifications.
What this means: At that frequency, the workday stops feeling like a sequence of tasks and starts feeling like one long recovery loop. This is why centralized task visibility matters so much. It reduces the need to keep checking multiple streams for the latest change.
How much email and chat volume do workers handle?
Microsoft says the average worker now receives 117 emails and 153 Teams messages per day.
What this means: Productivity is no longer just about prioritizing tasks. It is also about reducing the number of places where work can “be true,” so people do not have to scan messages all day to figure out what changed.
Source: Microsoft WorkLab - Breaking down the infinite workday
When do meetings hit focus hardest?
Microsoft reports that half of all meetings occur during peak productivity windows, specifically the 9-11 a.m. and 1-3 p.m. blocks when many workers do their best focused work.
What this means: Meetings do not just take time. They often take the highest-quality time. That makes poor meeting hygiene doubly expensive for teams trying to protect deep work and reduce context switching.
How many employees say work feels chaotic and fragmented?
Microsoft’s Work Trend Index finds that 48% of employees say their work feels chaotic and fragmented.
What this means: Fragmentation is now one of the clearest productivity problems in knowledge work. Teams often experience this as a feeling problem first, but it is really a workflow design problem underneath.
Source: Microsoft WorkLab - Breaking down the infinite workday
4. Weak productivity growth at the macro level
The micro-level picture of productivity loss matters even more because the macro backdrop is weak. When broader productivity growth slows down, organizations have less room to hide waste inside routine coordination habits.
How fast is labour productivity growing in 2024?
OECD productivity indicators show that average labour productivity growth across OECD countries slowed to about 0.4% in 2024.
What this means: This is not a claim about every economy equally, but it is a strong signal that productivity gains are currently hard won. When macro productivity is weak, low-value coordination becomes a bigger strategic cost.
What does weak productivity growth mean for workplaces in 2026?
Weak productivity growth means organizations are under more pressure to improve how work moves, not just how hard people work. The easiest gains are often hidden inside coordination overhead, reporting friction, and context loss.
What this means: When broad productivity growth is sluggish, workflow quality matters more. Teams that reduce work about work gain an advantage without needing longer hours or more layers of management.
Sources: OECD - Compendium of Productivity Indicators 2025
Asana - Work about work
5. Tools, visibility, and workflow design
This is where tools and workflow design become more than an operations choice. If people need to keep checking chat, email, docs, and meeting notes just to understand task status, the system itself is creating the productivity loss it later tries to measure.
Do centralized task systems improve productivity?
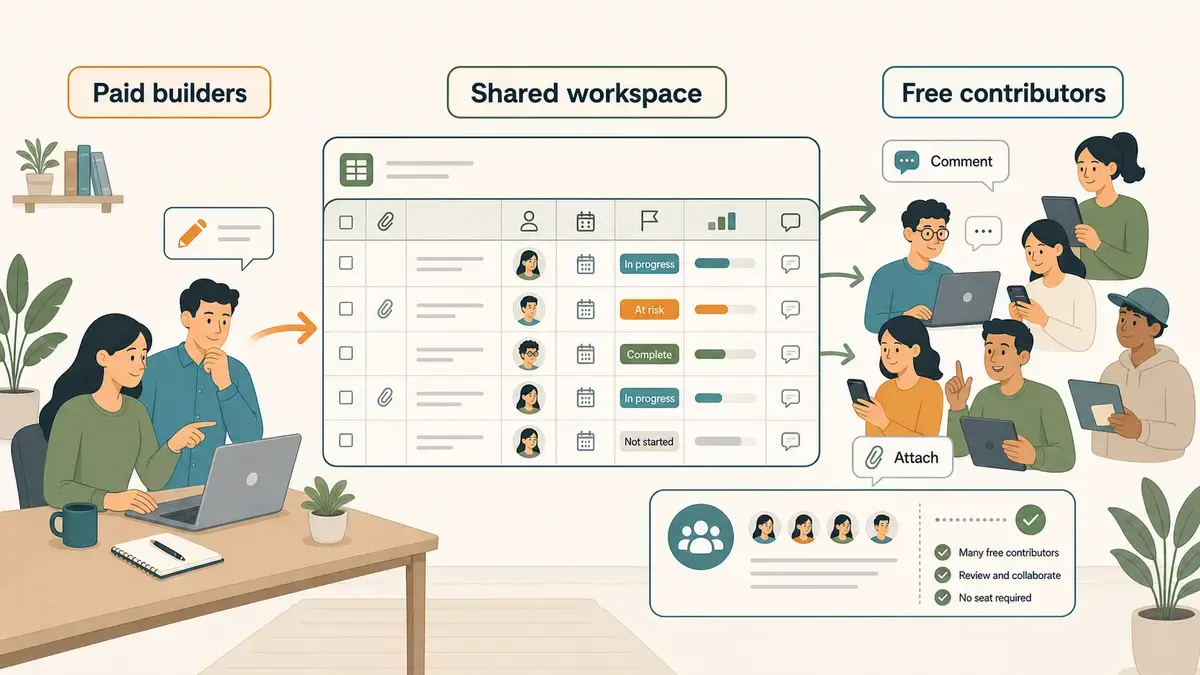
Collaboration and task systems improve productivity most when they reduce coordination friction: fewer duplicate updates, fewer “where is the latest update?” pings, and faster handoffs.
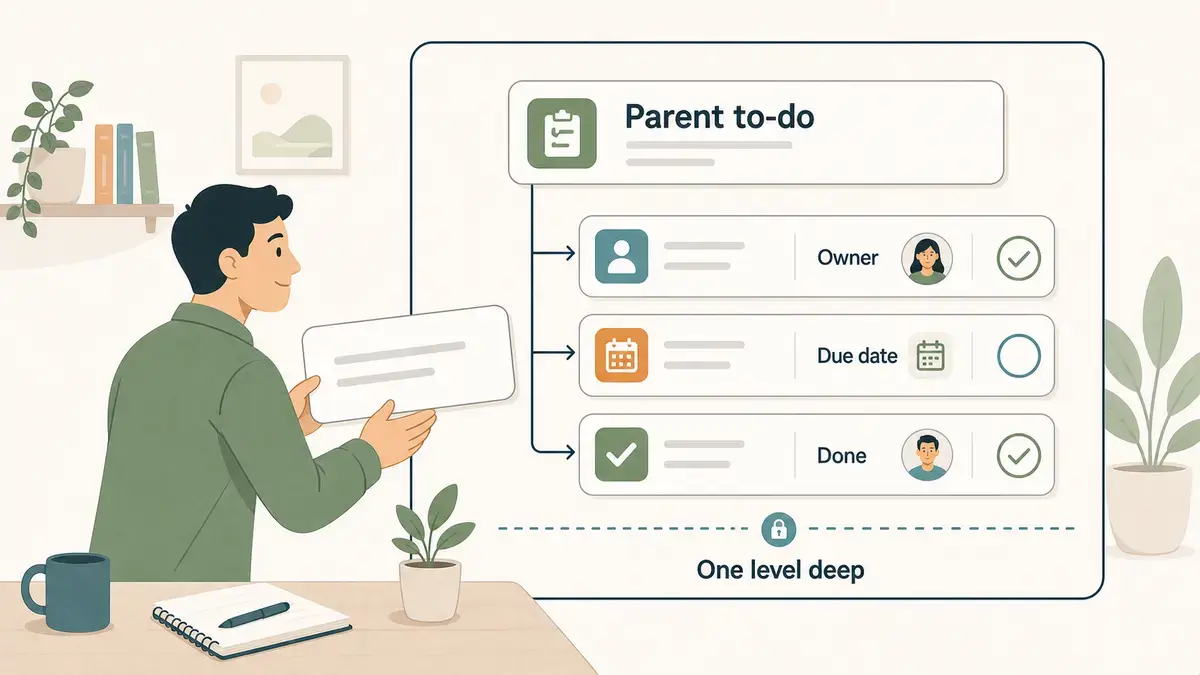
What this means: A visible board is useful because it keeps status, ownership, and discussion attached to the same work item. In Breeze, that means fewer context jumps between chat, docs, and separate trackers.
How much time is still spent on manual status collation?
Wellingtone reports that 47% of respondents do not have access to real-time project KPIs, and 50% spend one day or more each month manually collating project status information.
What this means: Manual status collation is a direct productivity leak. The more reporting has to be rebuilt by hand, the less likely teams are to keep updates current and useful.
Source: Wellingtone - The State of Project Management Report (PDF)
Why do visible boards reduce context switching?
Visible boards reduce context switching because they turn scattered updates into one readable workflow. When the owner, latest note, blocker, and next step sit on the task, people can re-enter work faster and ask fewer status questions.
What this means: Productivity becomes less about personal memory and more about system design. A shared board like Breeze lowers the cost of picking work back up because the context is already there.
Sources: Breeze - Meeting overload statistics
Breeze - Stop multitasking and context switching
If you want adjacent benchmarks, the related project management stats and time tracking stats show the same pattern from different angles: the teams that gain the most are usually the ones that make work visible and reduce reporting drag.
6. Time management, workload control, and output quality
How much work actually gets tracked against tasks?
Breeze data: 26.5% of the roughly 2 million tasks in Breeze have time logged against them.
What this means: even a modest amount of tracking turns invisible "work about work" into something a team can see and plan around. The value is visibility, not surveillance.
Source: Breeze internal data, roughly 2 million tasks, 2026.
Key takeaways
- Work about work still consumes most of the knowledge worker day.
- Meeting load and follow-up work absorb far more time than most teams account for.
- Weak labour productivity growth raises the cost of coordination drag.
- Task switching remains a measurable productivity penalty, even when exact impact varies.
- Interruption-heavy workdays create fragmentation, not flow.
- Even a modest amount of tracking - only about a quarter of Breeze tasks have logged time - turns invisible work into something teams can see and plan around.
- Manual status reporting is still common and still expensive.
- Centralized, visible workflows are one of the clearest practical fixes for modern productivity loss.
The productivity story in 2026 is not mainly about personal discipline. It is about whether the system helps people stay focused on meaningful output. Teams that centralize tasks, comments, and status in one visible workflow spend less time rebuilding context and more time moving real work forward.
FAQ
What are the most important workplace productivity statistics for 2026?
The most useful benchmarks are how much time goes to work about work, how much task switching hurts focus, how often employees are interrupted, and how weak broader productivity growth remains.
How much time do workers spend on work about work?
Asana reports that knowledge workers spend 60% of their time on work about work such as coordination, meetings, status chasing, and tool switching.
How much does context switching hurt productivity?
Task switching can reduce productivity by up to 40%, especially when work is fragmented across too many channels and tools.
How much time do meetings and low-value tasks take from real work?
A large share of the week can disappear into meetings, prep, follow-up, and low-value admin work. Some benchmarks put meetings at 20% to 40% of the workweek and low-value tasks at 51% of the workday.
How productive is the average workday?
One widely cited estimate puts average productive time at 2 hours and 53 minutes per day, which highlights how much of the day is lost to interruptions, admin, and fragmented attention.
Do productivity tools actually improve productivity?
Yes, but mostly when they reduce coordination friction. The biggest gains come from keeping tasks, updates, and decisions in one visible system rather than adding more disconnected tools.