How do you manage product roadmap milestones visually?
Contents
- Why do product roadmaps become disconnected from actual work?
- What does a visual roadmap workflow look like?
- How do you break roadmap items into actionable tasks?
- How do you track milestone progress in real-time?
- How do you adjust roadmaps when priorities change?
- How do you connect roadmap planning to sprint execution?
- Questions and answers
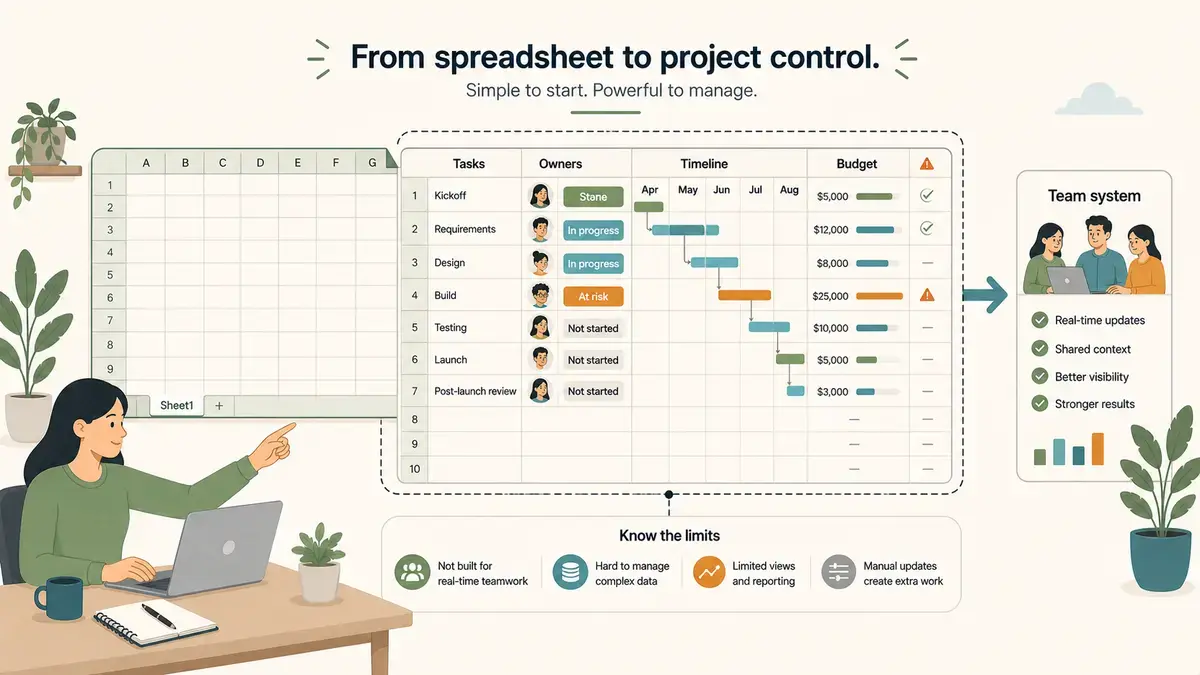
Product roadmaps become disconnected from actual work because they live in presentation slides or static documents while execution happens in completely different tools. Product managers create beautiful roadmap slides showing features and timelines. Development teams track actual work in Jira or task boards. The roadmap says one thing while execution reveals another. By the time the gap becomes obvious, teams are behind schedule with stakeholders expecting features that aren't ready.
Visual roadmap boards fix this by making the roadmap the actual work plan instead of a separate planning document. When roadmap milestones live on the same board as execution tasks, the roadmap stays connected to reality. Teams see if milestones are achievable based on actual progress. Stakeholders see real status instead of outdated plans. Breeze helps product teams create roadmap boards that connect strategic planning to daily execution in one visible workflow.
The best product roadmaps don't just communicate plans - they track actual progress toward those plans. When milestones connect directly to the work required to reach them, roadmaps stay honest instead of aspirational.
The goal is simple: make roadmap milestones visible alongside the work required to reach them. When milestones connect to tasks and progress updates automatically, roadmaps reflect reality. This guide shows how to manage product roadmaps visually so planning stays connected to execution instead of becoming obsolete the moment it's shared.
Key takeaways
- Roadmaps disconnect from reality when they live in slides while work lives in task tools.
- Visual roadmap boards make milestones the actual work plan, not separate documentation.
- Breaking milestones into tasks with deadlines shows if timelines are achievable.
- Progress tracking updates automatically as tasks complete, keeping roadmaps current.
- Priority changes propagate through the board, showing timeline and resource impact.
- Calendar views show whether milestone timing is realistic based on work remaining.
- Connecting roadmaps to sprints ensures strategic plans drive actual execution.
1. Why do product roadmaps become disconnected from actual work?
Product roadmaps become disconnected from actual work because they exist as presentation artifacts while execution happens in task management systems. While product managers often create roadmaps in slide decks, development teams execute work in Jira. This disconnection means the roadmap shows one idealized reality while the backlog reflects a completely different one. When a feature slips or priorities change, the roadmap doesn't update. Stakeholders make decisions based on outdated plans while teams know the real situation is different.
This disconnection creates three problems. First, expectation mismatches cause frustration. Leadership expects features by dates shown on the roadmap. Development knows those dates are impossible based on actual progress. The misalignment only becomes clear when deadlines pass and features aren't done.
Second, planning becomes unrealistic. When roadmaps don't account for current velocity or existing commitments, they show aspirational timelines instead of achievable ones. Teams know the plan won't work but have no data to support alternative timelines. Third, prioritization gets stuck. When a new opportunity appears or a crisis demands attention, teams shift focus but the roadmap stays unchanged. Stakeholders still expect roadmap features while teams work on different priorities.
Breeze solves this by making the roadmap a board where milestones are cards connected to the tasks required to reach them. Instead of a slide deck that gets outdated, the roadmap is a live board showing current state. Each milestone card links to feature tasks. As teams complete tasks, milestone progress updates. Stakeholders see real progress instead of planned timelines. When priorities shift, the board changes and everyone sees the new plan. The roadmap stays connected to execution because it is execution, just viewed at the milestone level.
A SaaS product team we worked with maintained a quarterly roadmap in slides that the product manager updated monthly. Between updates, the roadmap diverged from reality. Teams changed priorities based on customer needs or technical discoveries. By update time, the product manager spent hours reconciling what actually happened with what was planned. When they moved to a Breeze board where milestones linked to tasks, the roadmap updated itself. As teams moved task cards, milestone cards reflected progress. The monthly reconciliation became unnecessary because the roadmap tracked reality continuously.
Research shows that most product managers struggle to keep roadmaps up to date. The problem isn't discipline - it's that roadmaps exist separately from execution. When roadmaps connect directly to work, staying current becomes automatic. This pattern matches why project management tools fail — they exist separately from actual work. Understanding product launch management requires this same connection between planning and execution.
2. What does a visual roadmap workflow look like?
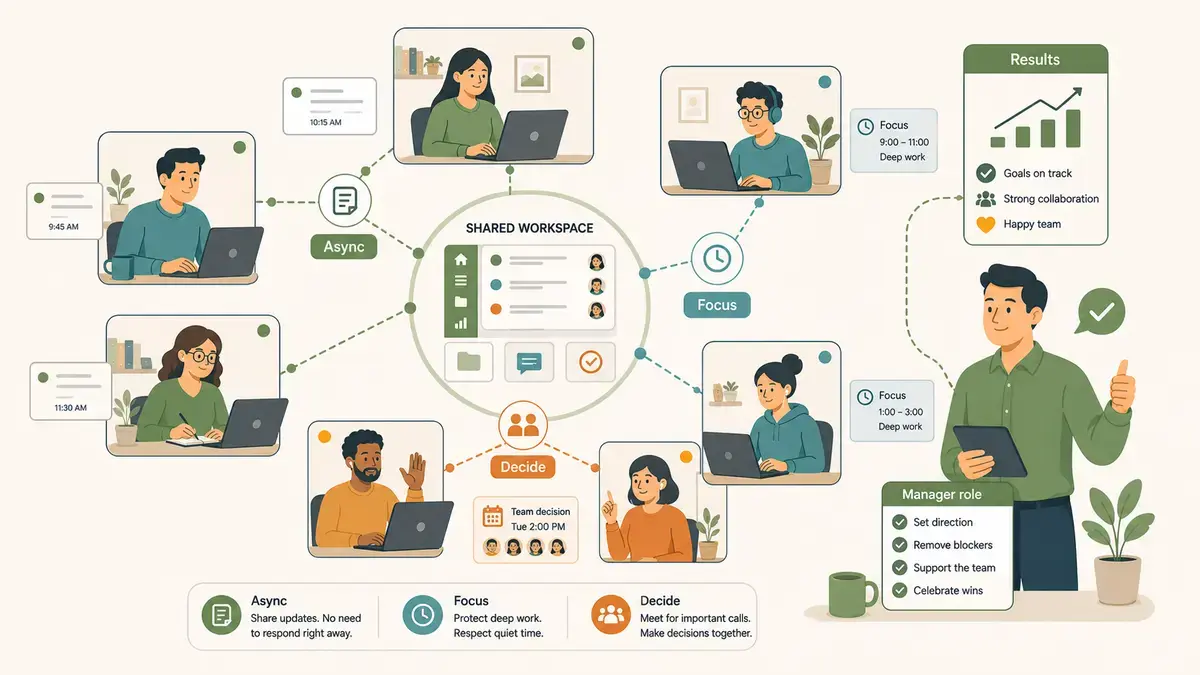
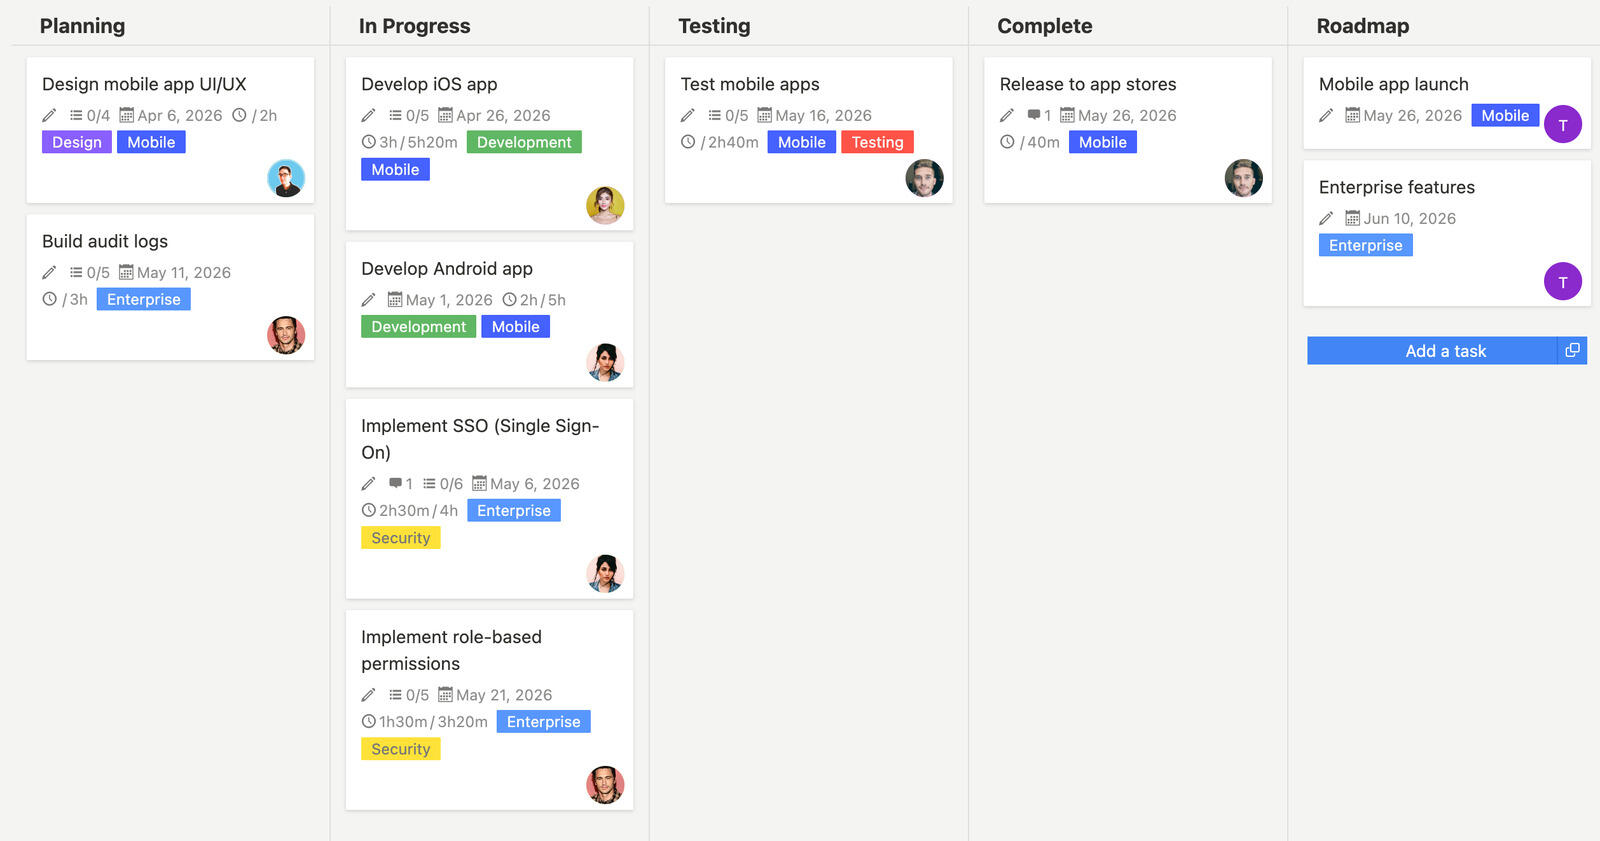
A visual roadmap workflow shows milestones as cards that progress through stages just like tasks, with each milestone linking to the work required to reach it. Milestones move through Discovery, Planning, Development, and Complete stages. Each milestone card shows target dates, completion percentage, and links to associated tasks. Teams see both strategic milestones and tactical execution on the same board. The workflow connects what we're building to when and why we're building it.
Using a visual workflow, this typically involves a board with two levels. The top level shows milestone cards representing major features, releases, or strategic objectives. The bottom level shows task cards for actual development work. Milestone cards link to task cards. As task cards move through In Progress, Review, and Done stages, milestone completion updates. Teams work at the task level. Stakeholders view at the milestone level. Both groups see current state instead of stale plans. The board serves execution and communication from the same data. Understanding what makes project management software simple helps teams choose tools that connect planning to execution.
Here's how static roadmap documents compare to live roadmap boards:
| Aspect | Static roadmap documents | Live roadmap boards |
|---|---|---|
| Currency | Outdated immediately after creation | Current based on real task progress |
| Connection to work | Separate from execution tools | Same system as execution tasks |
| Progress tracking | Manual updates based on reports | Automatic updates as work completes |
| Timeline accuracy | Aspirational dates disconnected from velocity | Achievable dates based on remaining work |
| Priority changes | Require new roadmap versions | Reflect immediately in milestone order |
| Stakeholder visibility | See plans from last update | See current state in real-time |
| Team coordination | Teams interpret roadmap into their own plans | Teams execute directly from milestone board |
The difference is that static roadmaps document plans while visual boards track progress. Static roadmaps answer "what did we plan to do?" Visual boards answer "what are we actually doing and how far along are we?" For stakeholders, this means seeing reality instead of plans. For teams, this means executing from the same system that communicates to stakeholders instead of maintaining parallel systems that drift apart.
Breeze makes this easy with features designed for roadmap management. Milestone cards support progress indicators showing completion percentage. Calendar view shows milestones on a timeline with tasks positioned under them. Filters let teams focus on current milestones while stakeholders view the full roadmap. Labels categorize milestones by theme, customer segment, or strategic goal. The board adapts to both detailed execution and high-level planning through different views of the same data.
For teams building operations workflows or managing content calendars, the same principle applies. Make plans visible alongside the work required to execute them. When planning connects to execution, plans stay realistic and execution stays aligned.
3. How do you break roadmap items into actionable tasks?
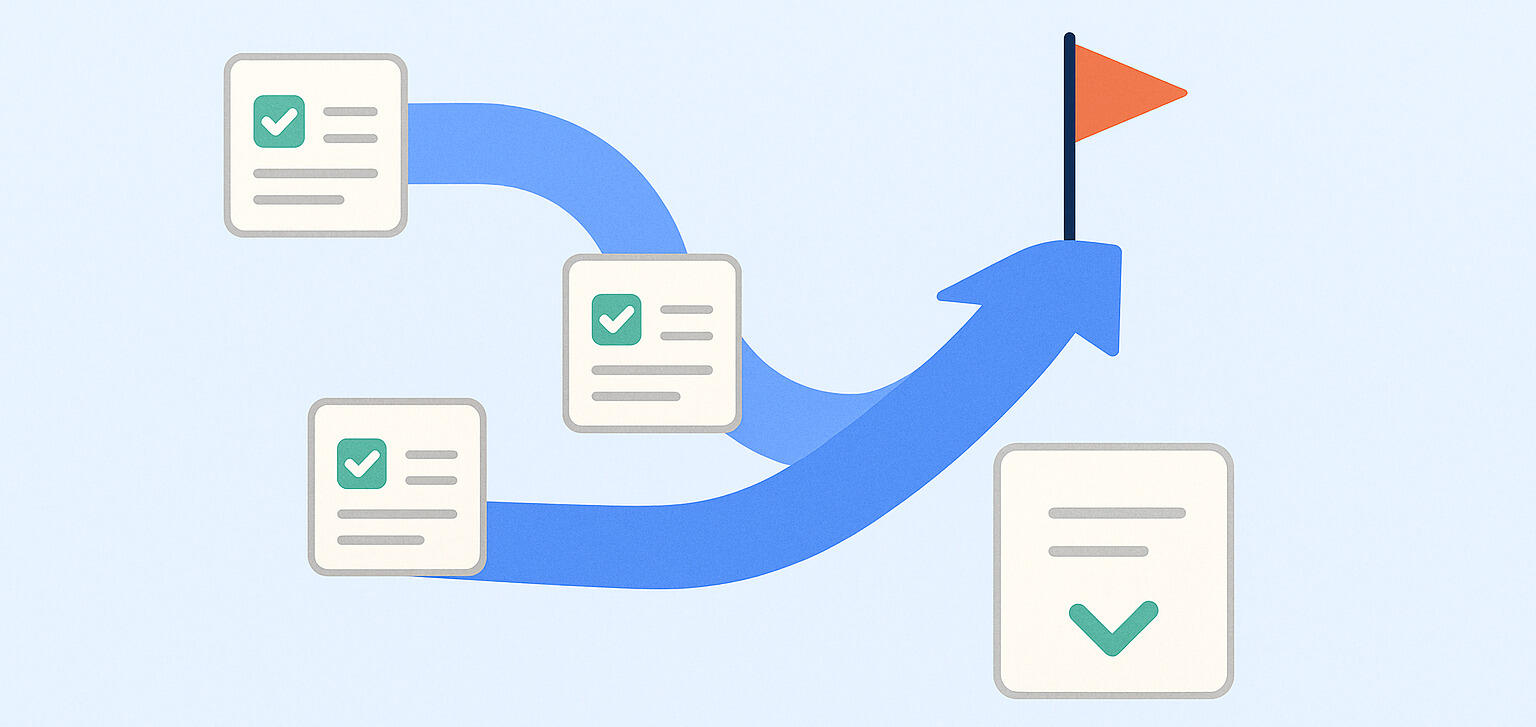
Break roadmap items into actionable tasks by creating a milestone card for each roadmap item, then adding task cards for the work required to complete that milestone. A milestone for "mobile app launch" gets task cards for design, development, testing, and release. A milestone for "enterprise features" gets task cards for SSO, audit logs, and role-based permissions. Each task card has an owner, due date, and clear deliverable. The milestone card links to all its tasks. Progress becomes measurable because milestones decompose into completable units of work.
Milestone cards function as containers for this decomposition. Create a card for the roadmap item with the target completion date and success criteria. Then brainstorm all the work required to reach that milestone. Create task cards for each major piece of work. Link the task cards to the milestone card. The milestone card shows how many linked tasks exist and how many are complete. As teams finish tasks, milestone progress updates automatically. The roadmap item transforms from an aspirational goal into a trackable set of specific tasks.
Task breakdown also reveals scope problems early. When a Q2 milestone links to 40 tasks and the team's velocity is 10 tasks per quarter, the math shows the timeline is impossible. This visibility enables better conversations. Product managers can descope the milestone, extend the timeline, or add resources. The decision is based on real data about scope and capacity instead of optimism about working harder. Teams catch unrealistic plans during initial breakdown instead of discovering them when deadlines approach.
Estimates on task cards also improve roadmap accuracy. When each task card has an estimate and an owner, rolling up task estimates to the milestone level shows total effort required. Comparing required effort to available capacity reveals whether the milestone is achievable in the target timeframe. If a milestone requires 200 hours of work and the team has 120 hours available before the target date, the timeline won't work. This math is obvious on a board where tasks have estimates and milestones have dates. It's invisible in a roadmap slide that just shows feature names and quarters.
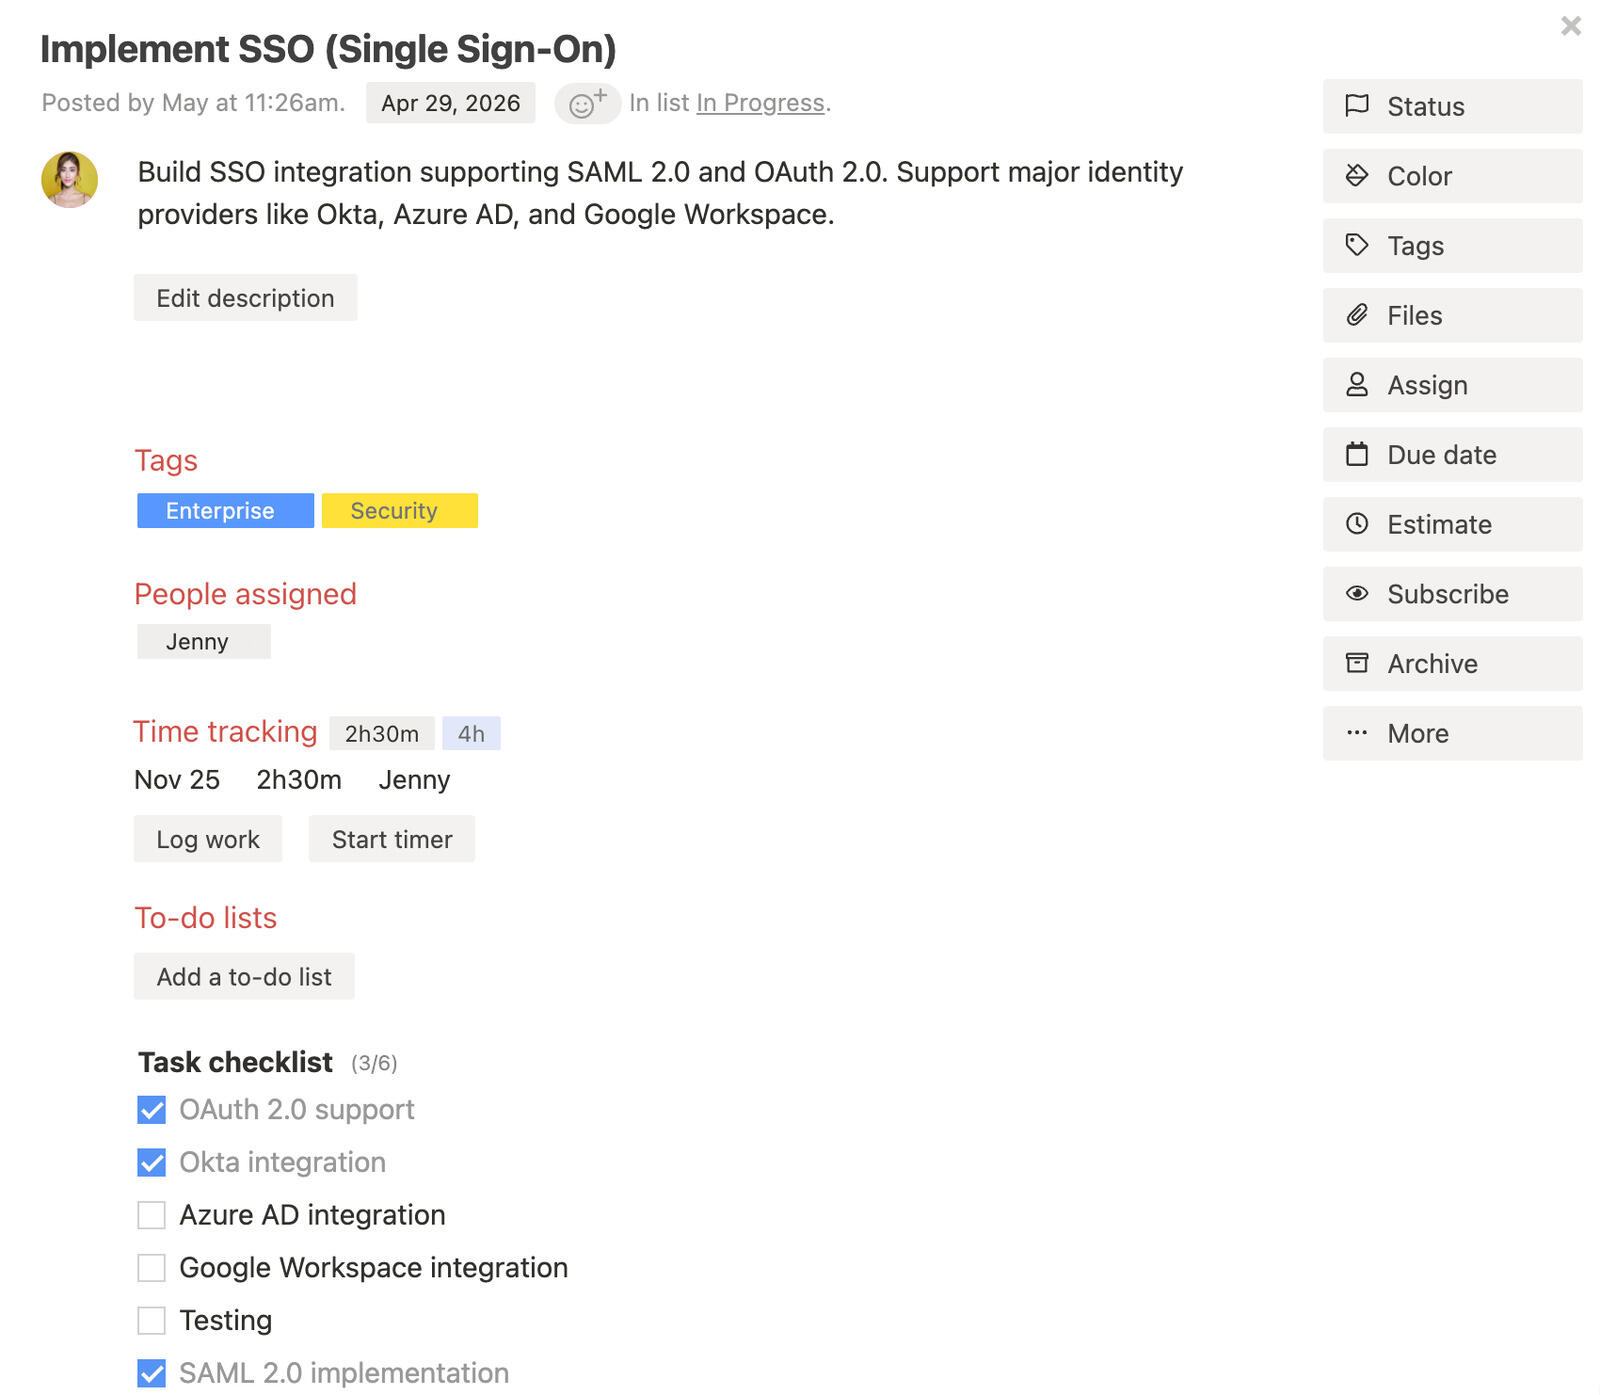
Breeze also supports checklists within task cards for smaller work items that don't need separate cards. A task card for "implement SSO" might have a checklist for different authentication providers. The checklist shows sub-task progress without cluttering the board. Teams work through checklists at the implementation level while the board shows major tasks. The milestone rolls up progress from tasks, which roll up progress from checklists. Every level stays connected.
According to project management research, projects with clear work breakdown structures are 2.5 times more likely to succeed. For product roadmaps, breaking milestones into tasks provides that structure. The roadmap stops being wishful thinking and becomes actionable execution. Teams know what to build. Managers know how much work remains. Stakeholders know if milestones are achievable. The breakdown makes everything more real.
4. How do you track milestone progress in real-time?
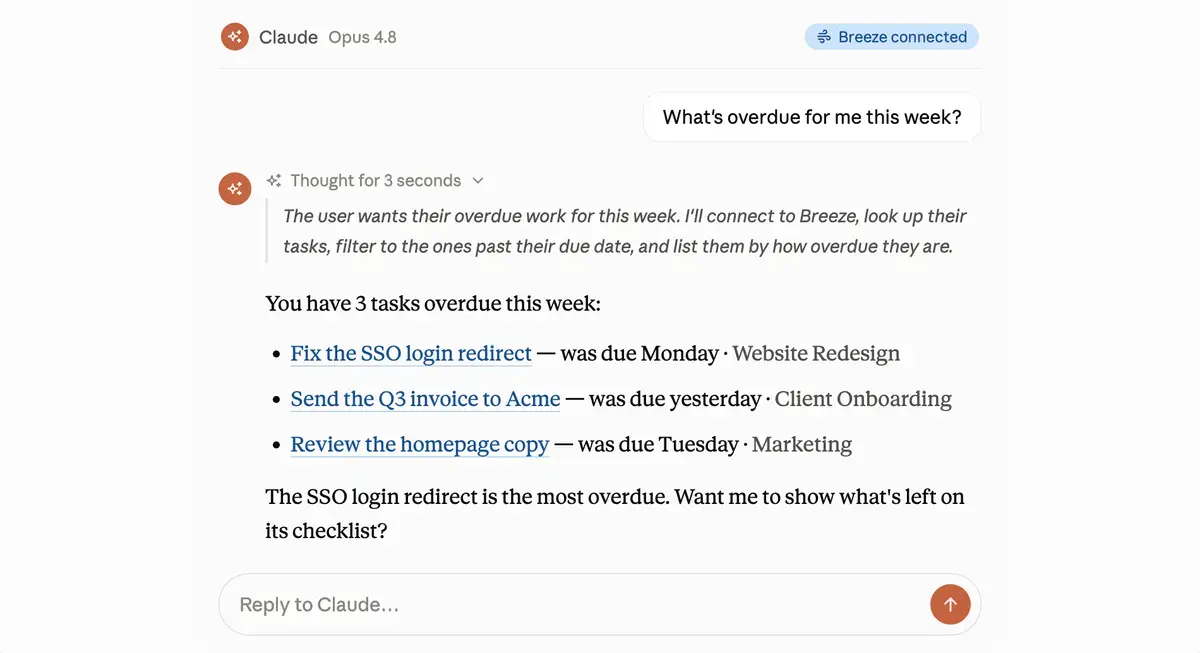
Track milestone progress in real-time by linking specific tasks to milestone cards so that status updates flow automatically from execution to strategy. When task cards link to milestone cards, milestone completion updates as tasks finish. A milestone with 10 linked tasks shows 30% complete when 3 tasks are done. Teams work on tasks without thinking about milestone updates. The board calculates progress. Stakeholders see current completion percentage without asking for status. Progress tracking becomes a side effect of normal work instead of extra reporting overhead.
Visual progress tracking happens through these card relationships. Link tasks to milestones when creating the roadmap. As tasks move to the Done list, they're marked complete. The milestone card updates to show how many linked tasks are complete. The percentage appears on the milestone card. Calendar view shows progress visually with color-coding. Stakeholders see milestone status at a glance. Teams never update a status report or fill out a progress form. The work itself generates the status.
Real-time progress also reveals risks earlier. When a milestone is targeting 50% completion by end of month but only 30% of tasks are done with 2 days left, the board makes the shortfall obvious. Product managers see the risk immediately and can discuss options - push the milestone date, reduce scope, or add resources. The conversation happens with 2 days left in the month instead of 2 days into the next month when everyone realizes the milestone was missed. Early visibility enables early intervention.
Progress tracking at the task level also provides diagnostic information that percentage alone doesn't capture. A milestone might show 60% complete based on task count but the remaining 40% might be the hardest tasks. Looking at which specific tasks remain helps assess whether 60% complete means 60% of time or more like 40% of time. Breeze lets stakeholders drill into milestone cards to see which tasks are done and which remain. They get context for the numbers instead of just numbers.
A product team we worked with tracked roadmap progress through monthly email updates. Product managers asked engineering managers for status on each milestone. Engineering managers aggregated status from team leads. Team leads estimated based on their understanding of what was done. By the time the progress report reached stakeholders, it was part summary, part estimate, and part wishful thinking. When they moved to a Breeze board where tasks rolled up to milestones, progress became factual. 7 of 10 tasks done meant 70% complete. No estimation. No summarization. No wishful thinking. Stakeholders trusted the numbers because the numbers came from actual work completion.
Breeze also supports custom fields for milestone tracking beyond basic completion. Add fields for confidence level, customer impact, or risk rating. Update these fields as milestones progress. A milestone might be 70% complete but high risk because the remaining tasks involve difficult integrations. The board shows both the progress and the concerns. Stakeholders get a complete picture instead of just a percentage. Understanding how to coordinate tasks across teams becomes easier when progress is automatically visible to everyone involved.
5. How do you adjust roadmaps when priorities change?
Adjust roadmaps when priorities change by reordering milestone cards, updating dates, and letting the board show the new plan automatically. When a new customer opportunity requires moving a feature up, drag its milestone card to higher priority, adjust its target date, and update related task dates. Everyone sees the change immediately through the board. When a technical issue requires delaying a milestone, push its date out and add a comment explaining why. The board reflects current priorities instead of original plans. Adjustment is fast because the roadmap is data, not a document that requires redesigning.
Priority changes are managed through simple card manipulation. Milestone cards can be reordered in their list to show new priority sequence. Due dates can be updated to reflect new timelines. When a milestone date changes, Breeze can prompt to adjust linked task dates proportionally. If a milestone moves from June to August, all its tasks can shift by two months automatically. The board updates to show the new timeline. No need to rebuild the roadmap presentation. No need to notify everyone about changes. The board is the source of truth and it's now showing the new truth.
Comments on milestone cards also document why priorities changed. When moving a feature from Q2 to Q3, add a comment on the milestone card explaining the decision. Mention stakeholders who need to know. The decision is documented with the milestone instead of living in meeting notes or email. Someone looking at the roadmap six months later can understand not just what changed but why. This creates organizational learning about what factors drive priority changes.
The board also makes priority change impact visible. When delaying Milestone A to prioritize Milestone B, see which tasks get affected. If developers working on A need to shift to B, their task cards move. The board shows resource allocation visually. Managers see if anyone becomes overcommitted or underutilized. The second-order effects of priority changes become obvious instead of being discovered later when conflicts arise.
Research shows that most product managers say their roadmaps change at least monthly. Traditional roadmap documents can't handle this change frequency. Every change requires updating slides, notifying stakeholders, and ensuring everyone has the latest version. Boards handle change naturally because there's no document to version - there's just current state. When current state changes, everyone sees it immediately.
Breeze also supports roadmap scenarios through board duplication. Before committing to a priority change, duplicate the roadmap board. Adjust priorities on the duplicate to see what the new plan looks like. If the adjustment works, make it on the real board. If it doesn't, delete the duplicate and try a different approach. This experimentation is fast on boards and impossible with document-based roadmaps. Teams make better priority decisions because they can test options quickly.
6. How do you connect roadmap planning to sprint execution?
Connect roadmap planning to sprint execution by making roadmap milestone cards the parent of sprint task cards. Each sprint pulls tasks from milestones. Sprint planning becomes about choosing which milestone tasks to tackle next instead of inventing work disconnected from strategic goals. Teams execute tactical sprints that roll up to strategic milestones. The roadmap drives execution instead of existing separately from it. Work that doesn't serve a roadmap milestone becomes questionable instead of invisible.
This connection relies on a unified board structure where milestones exist as high-level cards and tasks as detailed cards linked to them. Sprint planning pulls from the task backlog of current-priority milestones. The team picks tasks that fit the sprint capacity. Those tasks move into sprint execution lists. As the sprint progresses, completed tasks update milestone progress. The strategic roadmap and tactical sprints stay connected because they're both cards on the same board, just at different levels of granularity.
This approach also prevents scope creep and distraction. When sprint planning involves choosing from milestone tasks, work that doesn't serve roadmap goals is obvious. Someone proposing a task that doesn't link to any milestone needs to justify why. Either the task represents a missing milestone or it's work that shouldn't happen now. The board makes these questions visible. Teams stay focused on roadmap execution instead of drifting into reactive work or pet projects.
Labels also help connect roadmaps to sprints. Label tasks by the milestone they serve. Label them also by sprint number or time period. A task might have labels for "Mobile App Launch" (milestone) and "Sprint 23" (execution). Teams can filter by milestone to see all work toward that goal across sprints. Or filter by sprint to see just current execution. The same task cards serve both roadmap tracking and sprint execution through different views.
Breeze also supports velocity tracking that connects to roadmap planning. As teams complete sprint tasks, the board tracks velocity - tasks per sprint or story points per sprint. This historical velocity informs future roadmap planning. When adding a new milestone, estimate required tasks and check if capacity exists. If the team completes 20 tasks per sprint and a milestone requires 60 tasks, the milestone needs at least 3 sprints. The math is simple when the same board tracks both roadmap milestones and sprint velocity.
A development team we worked with had a problem with roadmap promises and sprint reality diverging. Product created roadmaps showing Q2 and Q3 features. Engineering planned sprints based on technical priorities and bug fixes. By mid-quarter, few sprint tasks connected to roadmap features. The roadmap became fiction while sprints were reality. When they moved to a Breeze board where roadmap milestones linked to sprint tasks, the gap closed. Sprint planning started with "which milestone tasks should we do next?" instead of "what should we work on?" The roadmap went from aspirational to actual because it drove sprint content.
According to Scrum.org guidance, the product backlog should be ordered to maximize the achievement of goals. When the product backlog lives on a board where goals are visible as milestone cards, ordering becomes natural. Tasks near the top serve current milestones. Tasks lower down serve future milestones or exploration. The backlog order reflects strategic priorities because the strategy is visible on the same board. For teams learning product launch management, this same connection between strategic launches and tactical execution makes launches more successful.
7. Questions and answers
- How do you handle roadmap planning for multiple products on one board?
- Use labels to separate products and filters to focus on each one. Create milestone cards for each product with product-specific labels. Teams can filter by product to see just their roadmap. Leadership can view all products together to see the complete portfolio. The board structure stays the same while labels provide organization.
- What if stakeholders want traditional timeline roadmaps for presentations?
- Use Breeze's calendar view to show milestones on a timeline. Export a screenshot for presentations. The calendar view provides the visual timeline stakeholders expect while staying connected to actual task data. Updates to the board automatically update the calendar view, so the presentation version stays current.
- How do you track dependencies between milestones?
- Link milestone cards just like task cards. If Milestone B depends on Milestone A completing first, link them. The board shows the dependency. Comments can explain why one milestone gates another. Teams see which milestones must happen in sequence versus which can run in parallel.
- What if a milestone needs to track more than just task completion, like design approval or customer validation?
- Add checklist items on the milestone card for non-task requirements. A milestone might link to 10 development tasks and have a checklist with items like "design approved", "legal review complete", "customer beta feedback". The checklist captures completion criteria beyond just finishing tasks. The milestone is complete when both linked tasks and checklist items are done.
- How do you handle exploratory work or research that isn't tied to specific milestones yet?
- Create a "Discovery" or "Research" milestone for exploratory work. Tasks that explore feasibility or investigate options link to this milestone. As research yields insights, specific feature milestones can be created and tasks can be relinked. The board shows both committed roadmap work and exploratory work through different milestones.
- What if milestone dates keep slipping and the roadmap becomes demotivating?
- Review whether milestones are scoped appropriately and if estimates are realistic based on actual velocity. Breaking large milestones into smaller ones creates more frequent completion moments. Also add buffer time to milestone dates based on historical accuracy. The board makes slip patterns visible so teams can improve estimation and scoping over time.