 Why choose Breeze
 Marketing
 Creative
 Sales
Sales Remote work
 Managers
 Product teams
 Project management
 Task management
 Kanban tool
 Time tracking
 Project reporting
 Project calendars
 Project timeline
 Team workload
 Project automation
 Project customization
 Chat
Chat Web forms
 Project roadmap
 AI
AI What's new
 Articles & guides
 Help center
 Mobile apps
 Integrations
 Developers & API
 Free tools
How do you use Excel for project management?

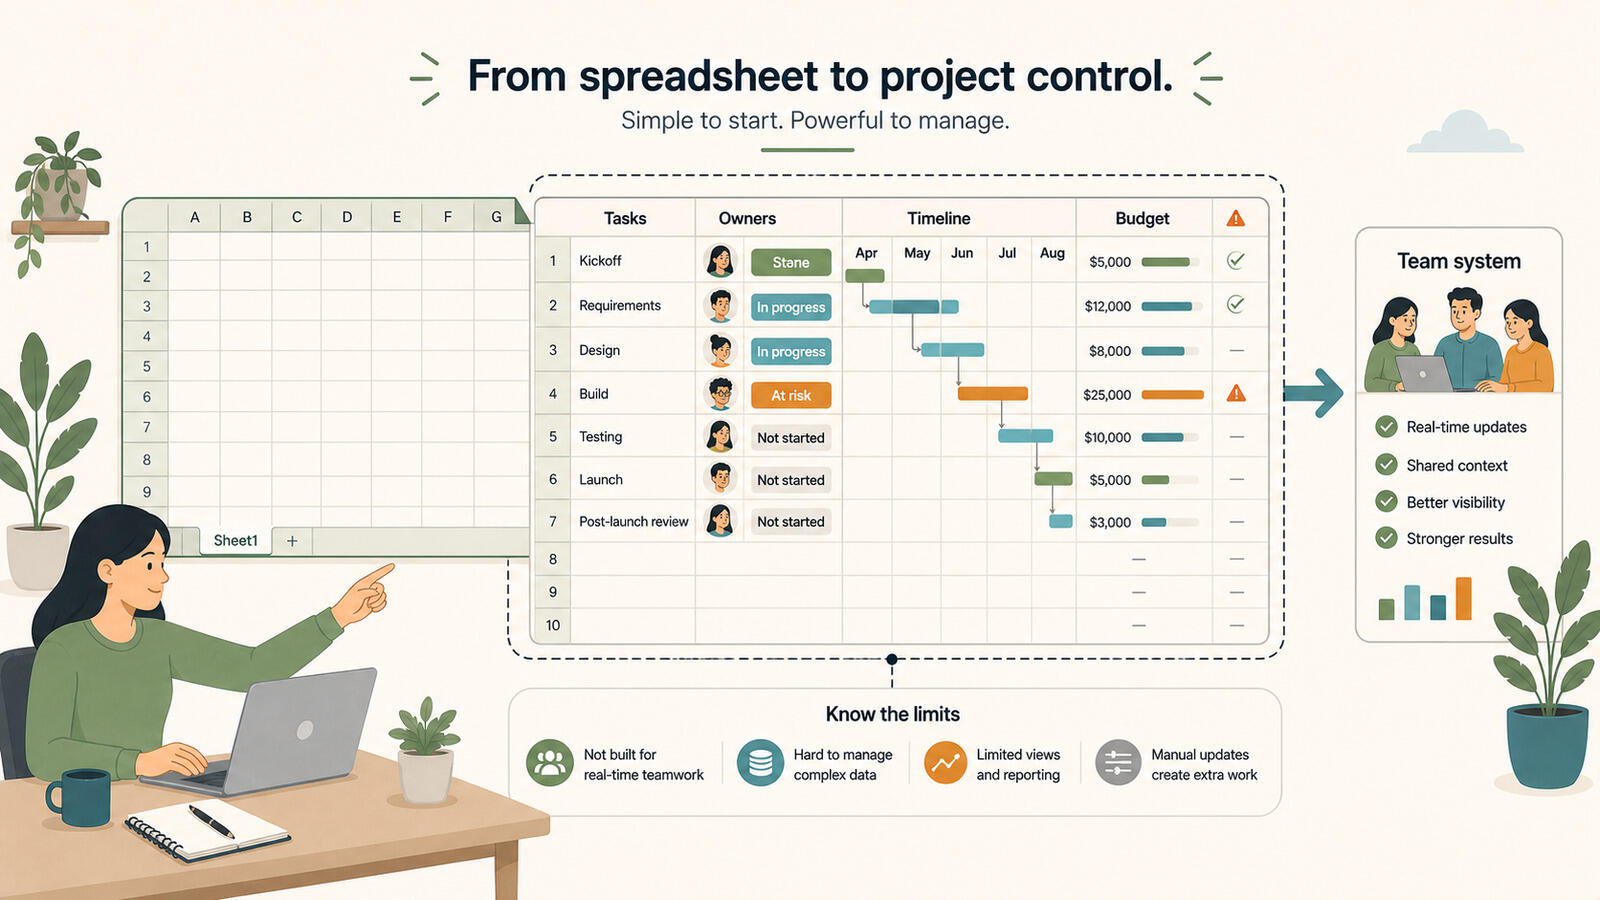
Yes, you can run a project in Excel, and for a small one it works fine. A spreadsheet with the right columns, a couple of filters, and a basic timeline keeps a solo freelancer or a two-person team on track for free. The catch is that Excel was never built to manage projects, so it holds up only while the project stays simple. The moment more people, more tasks, and real client communication arrive, the spreadsheet starts costing more time than it saves. This guide covers setting Excel up properly, and spotting where it stops being the right tool.
When is Excel the right call?
Excel is the right call when the project is small enough that coordination is barely a problem. If you can hold the whole thing in your head and just need a tidy place to write it down, a spreadsheet is hard to beat. Four situations make it sensible, and they tend to overlap.
The first is that you already know Excel well. If filters, formulas, and charts are second nature, you can fold project tracking into a tool you never have to learn. If they are not, learning Excel and learning to manage a project at once is two jobs, and you will fight the tool more than it helps.
The second is that the project is simple: a handful of tasks, a few dates, no tangled dependencies. If everything fits in one sheet, you need no dedicated software.
The third is that you work alone or nearly alone. Most of what project management software adds is built around collaboration, so for a solo freelancer or a two-person shop, much of that value disappears. There is no one to keep in the loop, so the loop need not exist.
The fourth is plain budget. Not every tool is expensive, and plenty offer free tiers, but if there is genuinely no room for another subscription, a free spreadsheet is a reasonable starting point. Better to run a project in Excel than in your inbox.
How do you build a task list in Excel?
The task list is the heart of any project setup, and in Excel it is the one thing the tool does really well. You build it in four steps, in about ten minutes.
Start with column headers. The usual ones are task name, owner, due date, status, and next step, but use whatever the project needs. Status earns its keep, telling you at a glance whether something is not started, in progress, or done. Then fill in a row for every task, so nothing lives in your head.
Now make it useful. Select a heading, open Sort and Filter, and click Filter. That drops a small arrow onto each column header. Click the arrow on the status column and you can hide everything except, say, the overdue or in-progress tasks. That single move turns a static list into something you can interrogate: what is due this week, everything assigned to one person, what is blocked.
Two small additions make this far more readable. Conditional formatting colours a status cell red, amber, or green automatically. And freezing the top row keeps your headers in view once the list grows past a screen. None of this is exotic, and it is roughly the structure any board view gives you for free. It is the same structure project boards give you once the work outgrows a spreadsheet. The underlying habit, naming each task and giving it an owner, a date, and a status, is the same one a good workflow is built on.
How do you make a simple timeline?
A timeline turns your task list into a visual you can plan against, so you can see when things are due and whether two big deadlines have quietly landed on the same day. Excel can produce a basic one, though it takes some fiddling, and the steps are worth knowing before you decide.
First, arrange your data in chronological order, with at least three columns. The unit of time holds the due dates. The event name holds the task names. The third, event height and direction, tells Excel where to place each label: positive numbers sit above the line, negative below, and you stagger the values so labels do not pile up unreadably.
With the data in place, build the chart. Select the unit of time and event height columns, open Insert, choose Charts, and pick Insert Column or Bar Chart. Choose Clustered Column from the 2-D options. Open Chart Elements, find Data Labels, click the arrow next to it, and choose More Options. In the Format Data Labels panel, uncheck Value and check Value From Cells, then select the event name cells in the Data Label Range box and click OK. Your task names now sit on the chart.
It works, but read that paragraph back. That is a lot of clicking for a timeline that does not update itself when a date slips. Every change to the plan means re-editing the data and sometimes the chart. For a one-off overview it is fine. As a living view of a moving project, it is the upkeep that makes people quietly abandon their spreadsheet two weeks in.
Where does Excel work, and where does it break?
The fairest way to judge Excel is to separate what it does well from what it cannot do at all. The pattern is consistent: it handles structured information for one person, and struggles the instant collaboration arrives.
| Job | Where Excel works | Where Excel breaks |
|---|---|---|
| Task lists | Fast to set up, filter, and sort for a single owner. | Gets unwieldy once many people edit the same file. |
| Team size | Fine for one person or a pair. | A few employees in, it cannot track who is doing what. |
| Communication | Not its job, and you may not need any. | No comments, mentions, or client updates of any kind. |
| Priorities | Filters surface urgent rows on demand. | Hard to keep the important work visible above the noise. |
| Timelines | A basic chart is possible with effort. | Nothing updates automatically when a date changes. |
| Cost | Free or already paid for. | The hidden cost is the time you spend maintaining it. |
Notice that almost every entry in the right-hand column is about people. The spreadsheet itself is a perfectly good container for information. What it has no answer for is several people depending on each other, needing to talk, and needing to know the state of the work without opening a file and reading it line by line.
When should you switch to real software?
Switch when maintaining the spreadsheet starts to feel like a second project. When updating the file, chasing people for status, and rebuilding the timeline takes as long as the actual work, the tool has stopped helping.
A few concrete triggers tend to arrive together. You add a third or fourth person and nobody is sure which version is current. You catch yourself emailing the spreadsheet around and merging changes by hand. A client asks for an update and the honest answer means reconciling three half-finished rows. Priorities shift and last week's filtered view no longer reflects reality. Each is small. Together they are the sound of a spreadsheet outgrowing its job.
The jump does not have to mean heavyweight, expensive software. Plenty of simple project management tools are built for exactly the small team that has outgrown Excel but does not want a complicated system. What you gain is not a longer feature list; it is that the goal, the tasks, the owners, the dates, and the conversation finally live in one shared place that updates itself, instead of a file that only tells the truth right after someone updates it.
This is where a tool like Breeze fits the same project you were running in cells. Each task becomes a card on a board with an owner, a due date, and a status you change by dragging, so progress is visible without anyone holding a meeting to ask. Comments, mentions, and reports cover the communication a spreadsheet has no room for, and the timeline view builds itself from your due dates instead of a forty-click chart wizard. If you are weighing options, it helps to know what matters when choosing project management software for a small team, so you do not overbuy.
Quick decision points
- Is Google Sheets any different from Excel for this?
- The trade-offs are nearly identical, with one real edge: Sheets is built for several people to edit at once, so you avoid the "which version is current" mess. It is the better free choice for a small team, but it hits the same wall on communication and self-updating timelines.
- Can I use Excel and a project tool together?
- Sometimes, yes. Excel stays useful for one-off analysis, budget math, and exports, even after the day-to-day work moves to a board. The mistake is keeping the live plan in two places, which doubles the upkeep you were trying to escape.
- What is the smallest project that justifies leaving Excel?
- It is less about size and more about people. A large solo project can stay in a spreadsheet happily. A small project with three people who need to talk and hand work back and forth is already past what Excel does well.
The short version
Excel is a genuinely good way to run a small, mostly solo project, and a frustrating way to run anything that involves a team coordinating, communicating, and depending on each other. Set it up with proper columns and filters and it carries you further than you might expect, right up to the point where it does not. Your next step is simple: look at your spreadsheet and ask how much of your week goes into maintaining it rather than doing the work. If the answer is climbing, move the same project onto a board and get the time back.