 Why choose Breeze
 Marketing
 Creative
 Sales
Sales Remote work
 Managers
 Product teams
 Project management
 Task management
 Kanban tool
 Time tracking
 Project reporting
 Project calendars
 Project timeline
 Team workload
 Project automation
 Project customization
 Chat
Chat Web forms
 Project roadmap
 AI
AI What's new
 Articles & guides
 Help center
 Mobile apps
 Integrations
 Developers & API
 Free tools
How do you solve complex problems with systems thinking?

You solve a complex problem with systems thinking by treating the thing in front of you as a symptom, not the problem. Instead of fixing the visible event, you trace it down to the structure that keeps producing it, then change that structure. A problem feels unsolvable mostly because everyone has been attacking the surface: the late delivery, the angry client, the blown budget. Systems thinking is the discipline of zooming out far enough to see the loops that generate those events, so your fix holds instead of bouncing back a month later. The good news is you get most of the value from the mindset alone, long before any diagram or software.
What systems thinking actually is
Systems thinking is an approach to solving complex problems by understanding the systems that allow them to exist. It was founded in 1956 by MIT professor Jay Forrester, and the central idea has not changed since: where traditional analysis zooms in on one piece of a whole, systems thinking zooms out to see the whole, plus the other wholes pushing on it. A problem is not an isolated fault to cut out. It is the output of interacting parts, and if you only touch the output, the parts produce it again.
That sounds abstract until you watch it play out. A team keeps shipping bugs, so management adds a review gate. Reviews slow everyone down, so people batch bigger changes to dodge the gate, so each change is riskier, so more bugs slip through. The fix made the problem worse because it ignored the loop it sat inside. Systems thinking gives you the tools to see that loop first, which is why it works on problems that defeat ordinary analysis.
What you get out of this is more than a better answer. Systems thinking treats failure as information, so small missteps become a fast way to rule out wrong options rather than disasters to hide. It is collaborative by nature, because no single person sees a whole system. And it gives you foresight: once you can read how the parts interact, you can predict how a change in one place ripples through the rest, instead of being ambushed by side effects later.
When you actually have a complex problem
This matters first, because systems thinking is overkill for ordinary problems. Applying smart charts to raw data in a spreadsheet is not complex, it is complicated with a known method. A genuinely complex problem has a different signature, recognisable by four traits.
First, there is no clean agreement on what the problem even is, because the context it depends on keeps shifting. Second, the real causes are hard to pin down, because many factors and feedback loops influence each other at once. Third, the right next step is uncertain, because there are several partial solutions and some of them conflict. Fourth, ownership is murky: it is hard to say who has enough authority and accountability to fix it, and keeping stakeholders from working at cross purposes is a constant effort. Check most of those boxes and you are not being slow or unlucky. You are dealing with a system, and it needs to be approached like one.
How the iceberg framework works
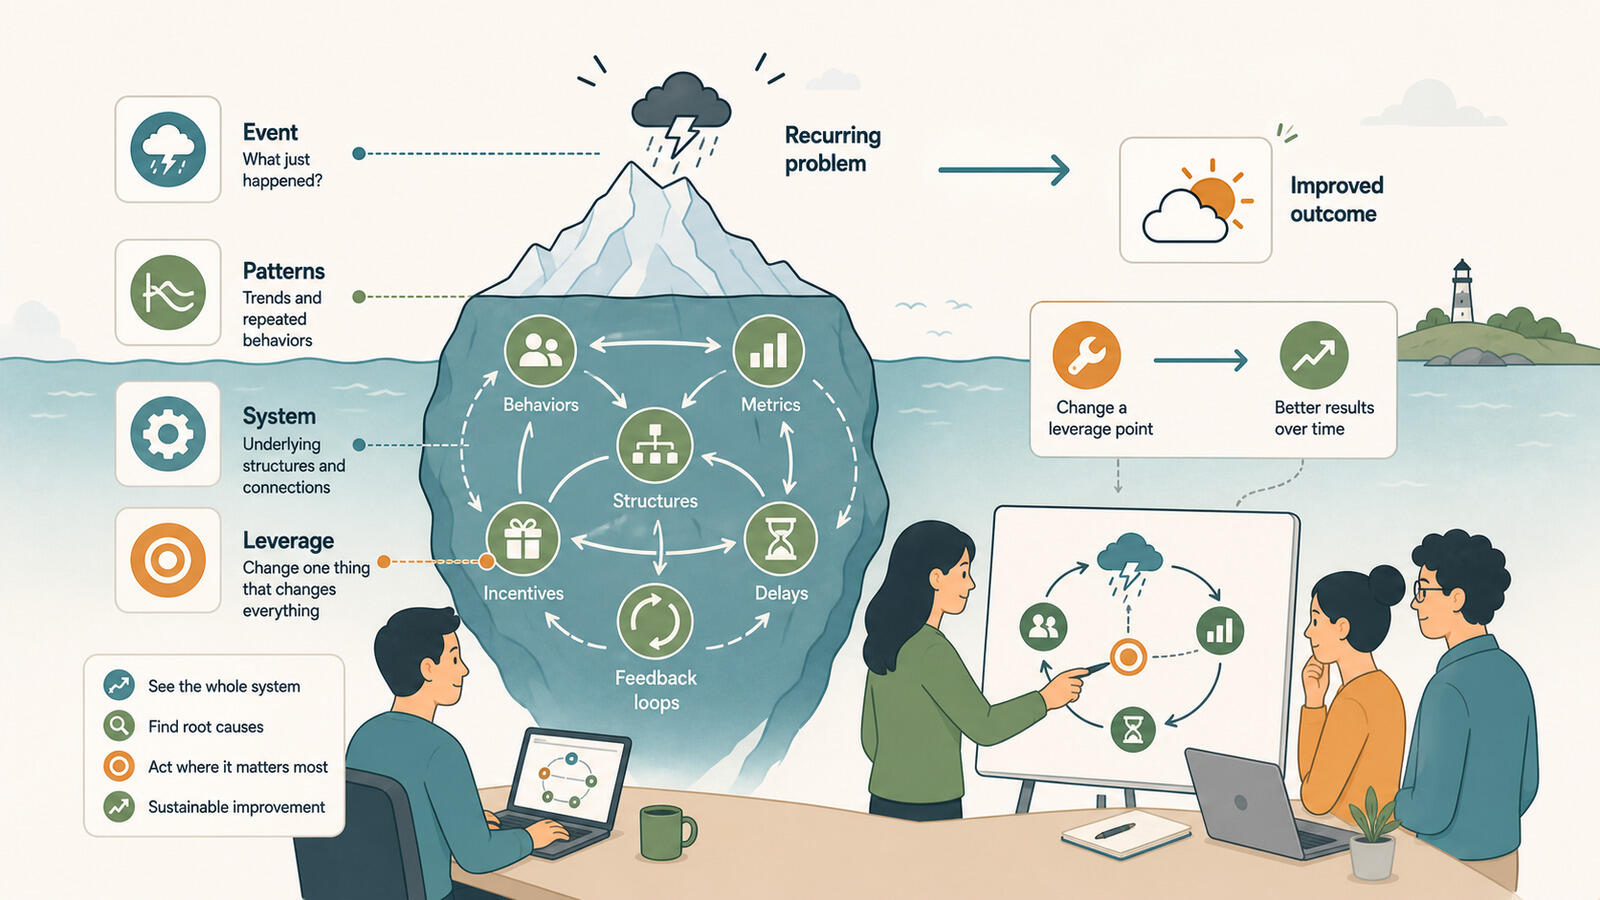
The iceberg is the single most useful tool here, and it needs no software. It maps four levels of thinking about a problem, from the obvious tip down to the part that holds everything else up. The whole skill is learning to keep descending instead of stopping at the first level, where almost everyone gets stuck.
The four levels
At the top sit events, the most visible part of a problem and the part that screams to be addressed right now. But events are usually just symptoms, so acting only here is the shallowest response. One level down are patterns and trends, the first thing hidden from view. Thinking harder about a string of events reveals the patterns producing them, and addressing a pattern resolves far more events than firefighting one at a time.
Deeper still is the underlying structure: the way components interact to generate those patterns. This is where real leverage lives, because change the structure and the patterns change with it. At the bottom are mental models, the assumptions and beliefs people hold about the system. These quietly create and maintain the structures above them, which produce the patterns, which surface as events. Most failed fixes change an event while the mental model underneath keeps rebuilding the same structure.
Here is the same problem read at all four levels.
| Iceberg level | What you see or ask | Example: projects always run late |
|---|---|---|
| Events | The visible symptom, demanding a reaction now. | This release slipped by two weeks. |
| Patterns and trends | What keeps happening over time? | Every release for a year has slipped. |
| Underlying structure | What setup produces that pattern? | Estimates ignore review and rework time entirely. |
| Mental models | What belief holds the structure in place? | "A confident estimate looks weak if it includes slack." |
Read the table bottom to top and the fix becomes obvious in a way it never is at the surface. You will not stop slipping releases by working weekends. You stop them by changing the belief that padded estimates look weak, which changes how estimates are built, which changes the pattern.
Which tools to reach for, and when
Once the iceberg has you asking better questions, there are heavier tools for mapping how a system behaves. You do not need all of them, and reaching for the advanced ones too early is its own quick fix.
Causal loop diagrams and system archetypes
The most common and flexible tool is the causal loop diagram, which shows the cause-and-effect links between components with direction, so you can see how a change in one place feeds back around the loop. It surfaces where a small, well-placed nudge can swing the whole loop in your favour, and it makes quick fixes look as risky as they are. System archetypes go further: they are generic templates of how complex systems tend to misbehave, well studied enough that recognising one tells you where the useful interventions, called leverages, usually sit. There are two basic feedback loops, reinforcing and balancing, and they combine into roughly nine recurring archetypes, depending on who is counting.
- Balancing loops with delays
- Drifting goals
- Escalation
- Fixes that fail
- Growth and underinvestment
- Limits to success
- Shifting the burden
- Success to the successful
- Tragedy of the commons
None of these is a full model on its own. They give you a starting shape, a high-level map of common behaviour you can specialise into your situation. Spotting "fixes that fail" in your own team, for instance, is often enough to stop you shipping the next one.
When to go quantitative
Causal loop diagrams and system archetypes are static pictures: they cannot show how a system evolves over time. To actually watch a loop play out under changing assumptions, you need system dynamics modelling, where a computer simulates how your diagram behaves over time. That is real work, only worth it once the cheaper tools have confirmed you are dealing with a complex system.
How to apply it to a real project
So should you go buy system dynamics software the moment a project problem resists you? No. You get most of the benefit from the mindset alone, with no diagrams at all.
Start by running your stuck problem down the iceberg. Asking "is this an event or a pattern?" tends to expose the quick fixes that feel productive but never stick, the classic ones being "we need more budget" or "we need to hire more people." Those are event-level moves that rarely touch the structure underneath. A clear-eyed look at project risks does similar work, surfacing causes before they compound.
It also helps to make the system visible, because no one person holds the whole picture. In Breeze, putting every task, owner, and due date in one place turns invisible patterns into something the team can point at - which stage work piles up in, which handoffs keep stalling, which estimates keep missing. That lets a group descend the iceberg together instead of each person defending a corner. When you find a candidate leverage point, the 80/20 rule is a useful check: a true one moves most of the outcome with a small change. If your fix touches everything equally, it probably is not one.
Finally, write down what you decide to change and why. A complex fix is a hypothesis, not a guarantee, and treating it that way is the whole spirit of systems thinking. Folding the decision into a simple project plan keeps it honest: you stated what you expected, so you can tell whether the structure shifted or the pattern just went quiet.
Common questions
- How do I know a problem is complex and not just hard?
- A hard problem has a known method you have not finished applying. A complex one has feedback loops, shifting context, conflicting partial fixes, and unclear ownership. If your last three fixes each made something else worse, that is the tell.
- Do I need to learn causal loop diagrams to start?
- No. The iceberg framework alone, used as a set of questions, gets you most of the way. Diagrams and modelling are for when you have confirmed a real system and need to test it.
- What is a leverage point in practice?
- It is the small, often non-obvious place where a change ripples through the whole system. Usually it sits at the structure or mental-model level, not the event level, which is why it is easy to miss.
The short version
Systems thinking solves stubborn problems because it makes you fix the structure that generates them instead of the symptom that annoys you, and the iceberg framework is enough to start today. The next time a problem keeps coming back, resist the first fix, ask whether you are looking at an event or a pattern, and keep descending until you reach something worth changing.