Tracking project progress
We just released another update to the project analytics, now it's even more awesome. The analytics is now renamed to progress and has a lot more insights about your project progress.
The new progress charts are a good way to track and forecast projects. They let you visualize your effort and overall progress. You can quickly check the project status, see how much work has been done, whats in progress and how much needs to be still done. To make it possible we take a snapshot of all your projects every day and count the number of tasks in every list and the different statuses.
These charts are also often used in lean and agile project management to measure different kinds of progress and efficiency in projects and are known as cumulative flow diagrams.
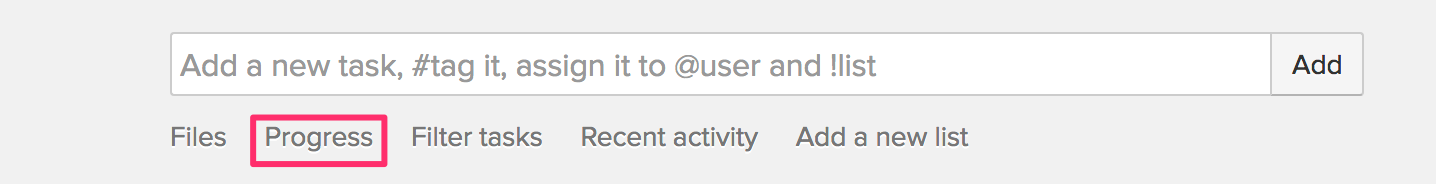
You can find the link to the progress charts in every project board under the task quick input box.
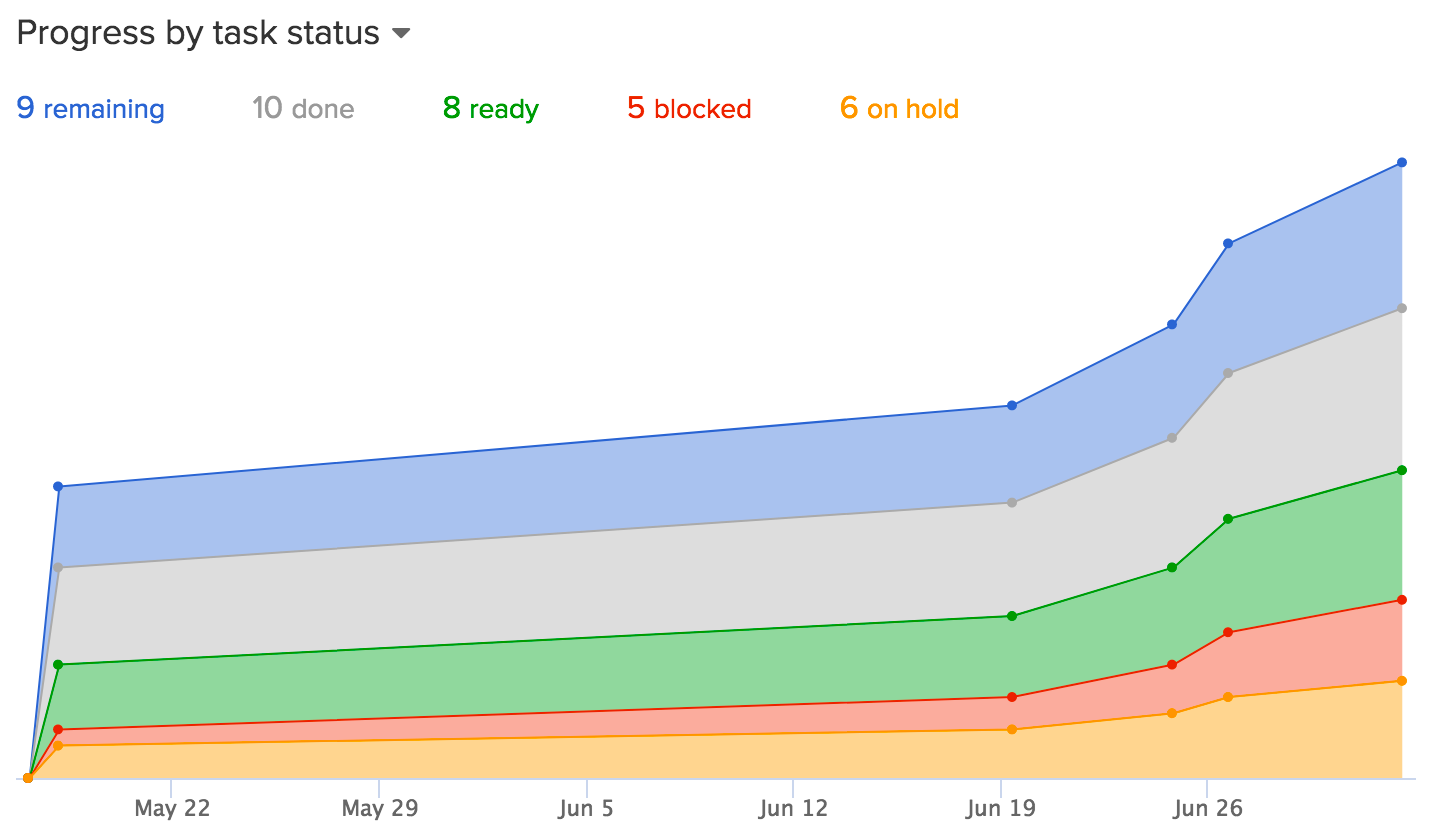
You can check the progress by task status and task list. Progress by task status shows you the number of tasks with all the statuses over time.
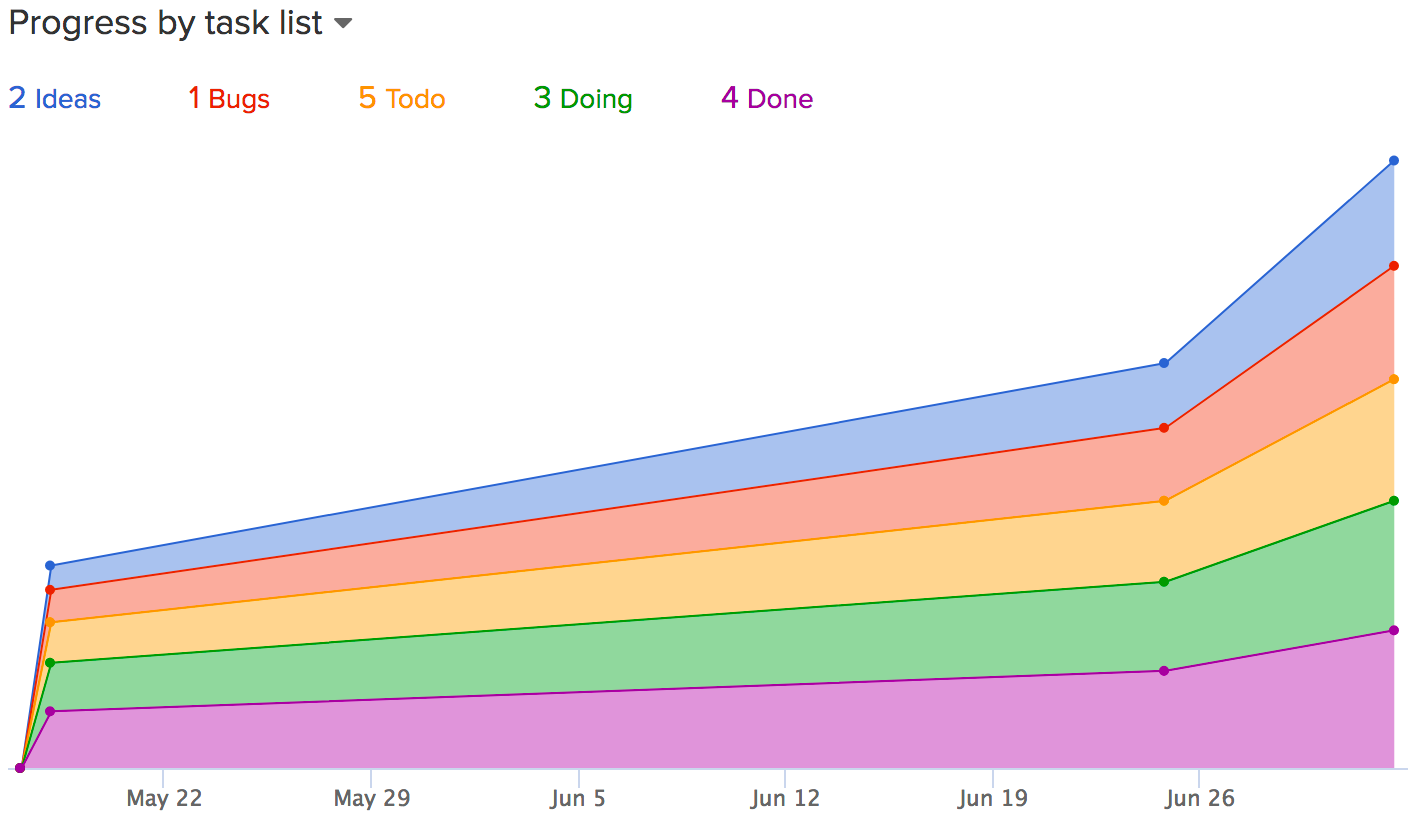
Progress by task list shows you the number of tasks in each list over time.
How to use the charts?
The charts are very simple but can tell you a lot about your project progress. On the vertical axis you have a number of tasks and on the horizontal you have the timeline. The areas in the chart show you the cumulative task statuses or the number of tasks in a list over time. Cumulative means that the values are accumulated over time.
How should it look?
The chart should look smooth from left to right. The areas should stay more or less even over time. Bubbles or gaps in the areas are an indication of shortages or bottlenecks. Blocking tasks can create large backups in some parts of the project and starvation in others. Unchecked backlog of tasks can grow over time. These are the places look for ways improve your progress.
Task completion analytics
Task completion analytics is also available from here. You can instantly see tasks that are taking too long to complete. Move your mouse over the small dot in the graph and you'll see how long the task has stayed in each list.
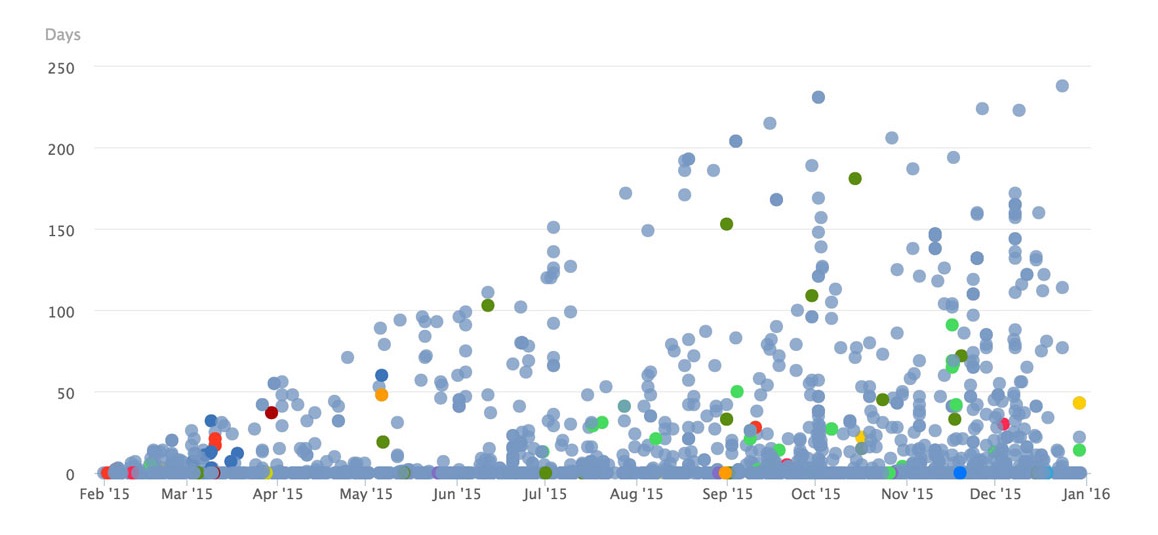
Please check out our previous post on the task completion analytics feature and how to use the lead and cycle times.